


What is the difference between web analytics and product analytics?
Contents
In a nutshell:
Web analytics is good for tracking and monitoring high-level website metrics like page views, bounce rate, and the top sources of traffic. It's a pre-defined dashboard, so it's easy to quickly dip into and find what you need.
Product analytics is good for diving deep into how specific users, or groups of users, behave. There are dashboard templates to help you get started, but you can build custom insights and dashboards to your precise needs, and use notebooks for adhoc analysis.
Here's a quick comparison:
| Web analytics | Product analytics | |
Dashboards | One, pre-built | Unlimited, customizable |
Custom insights | ✖ | ✔ |
Events | Pageview, pageleave, conversions | Any, custom |
Properties | Limited, pre-defined | Any, custom |
Built for | Small teams, marketers | Engineering, product, data teams |
Use case | At-a-glance view of website traffic | Analysis of product usage and user behavior |
Why do the numbers differ?
You might notice that metrics like unique visitors or pageviews show different numbers in web analytics compared to a similar query in product analytics. This is expected and happens because the two tools count things differently.
Session-based vs event-based counting
Web analytics groups data by sessions and counts metrics based on when the session started. Product analytics counts events based on when they occurred.
Example: A visitor starts browsing your site at 11:55 PM on December 31st and views 3 pages, with the last pageview at 12:05 AM on January 1st.
- Web analytics (for Jan 1-7): The session started on Dec 31st, so this visitor may not be counted in your January range
- Product analytics (for Jan 1-7): The pageview at 12:05 AM is counted because the event occurred on January 1st
Date boundary handling
Web analytics attributes all metrics to the session start time, not when individual events occurred. To calculate accurate session metrics (like duration and bounce rate), it fetches session data with a 3-day buffer around your selected date range, but only counts sessions that actually started within your range.
Example with sample data:
Suppose you're looking at data for February 1st, 2025 and have these pageviews:
| Session | User | Session start | Pageview time | Path |
|---|---|---|---|---|
| A | Alice | 2025-01-31 23:50 UTC | 2025-01-31 23:50 UTC | /pricing |
| A | Alice | 2025-01-31 23:50 UTC | 2025-02-01 00:05 UTC | /docs |
| A | Alice | 2025-01-31 23:50 UTC | 2025-02-01 00:10 UTC | /signup |
| B | Alice | 2025-02-01 14:00 UTC | 2025-02-01 14:00 UTC | /dashboard |
| B | Alice | 2025-02-01 14:00 UTC | 2025-02-01 14:15 UTC | /settings |
| C | Bob | 2025-02-01 10:00 UTC | 2025-02-01 10:00 UTC | /blog |
| C | Bob | 2025-02-01 10:00 UTC | 2025-02-01 10:15 UTC | /pricing |
| C | Bob | 2025-02-01 10:00 UTC | 2025-02-01 10:30 UTC | /demo |
| D | Carol | 2025-02-01 23:55 UTC | 2025-02-01 23:55 UTC | /home |
| D | Carol | 2025-02-01 23:55 UTC | 2025-02-02 00:10 UTC | /features |
Web analytics results (session-based, for Feb 1):
| Metric | Count | Explanation |
|---|---|---|
| Unique users | 3 | Alice, Bob, Carol. Session A excluded (started Jan 31), but Alice still counted via session B. |
| Pageviews | 6 | Sessions B (2) + C (3) + D (1). Session A's Feb 1 pageviews excluded because session started Jan 31. |
Product analytics results (event-based, for Feb 1):
| Metric | Count | Explanation |
|---|---|---|
| Unique users | 3 | Alice, Bob, Carol—all had events on Feb 1. |
| Pageviews | 8 | Alice: 4 (2 from session A + 2 from B), Bob: 3, Carol: 1. Counts all Feb 1 events regardless of session start. |
The key difference: web analytics groups by session start time, while product analytics counts events by when they occurred. Alice's pageviews at 00:05 and 00:10 on Feb 1 are counted in product analytics but excluded from web analytics because her session started on Jan 31.
Which number is "correct"?
Both are correct—they're just measuring different things:
- Web analytics answers: "How many sessions happened during this period?"
- Product analytics answers: "How many events occurred during this period?"
For most website metrics, the session-based approach in web analytics gives you a more accurate picture of user behavior. For precise event counting or custom analysis, use product analytics.
When should you use web analytics?
Web analytics gives you a single, pre-built dashboard for a high-level overview of your site. It's about collecting data in the aggregate, as opposed to tracking specific interactions from specific users.
It can help you figure out which pages and products are most popular and resonate the most with people.
You can use web analytics to find out:
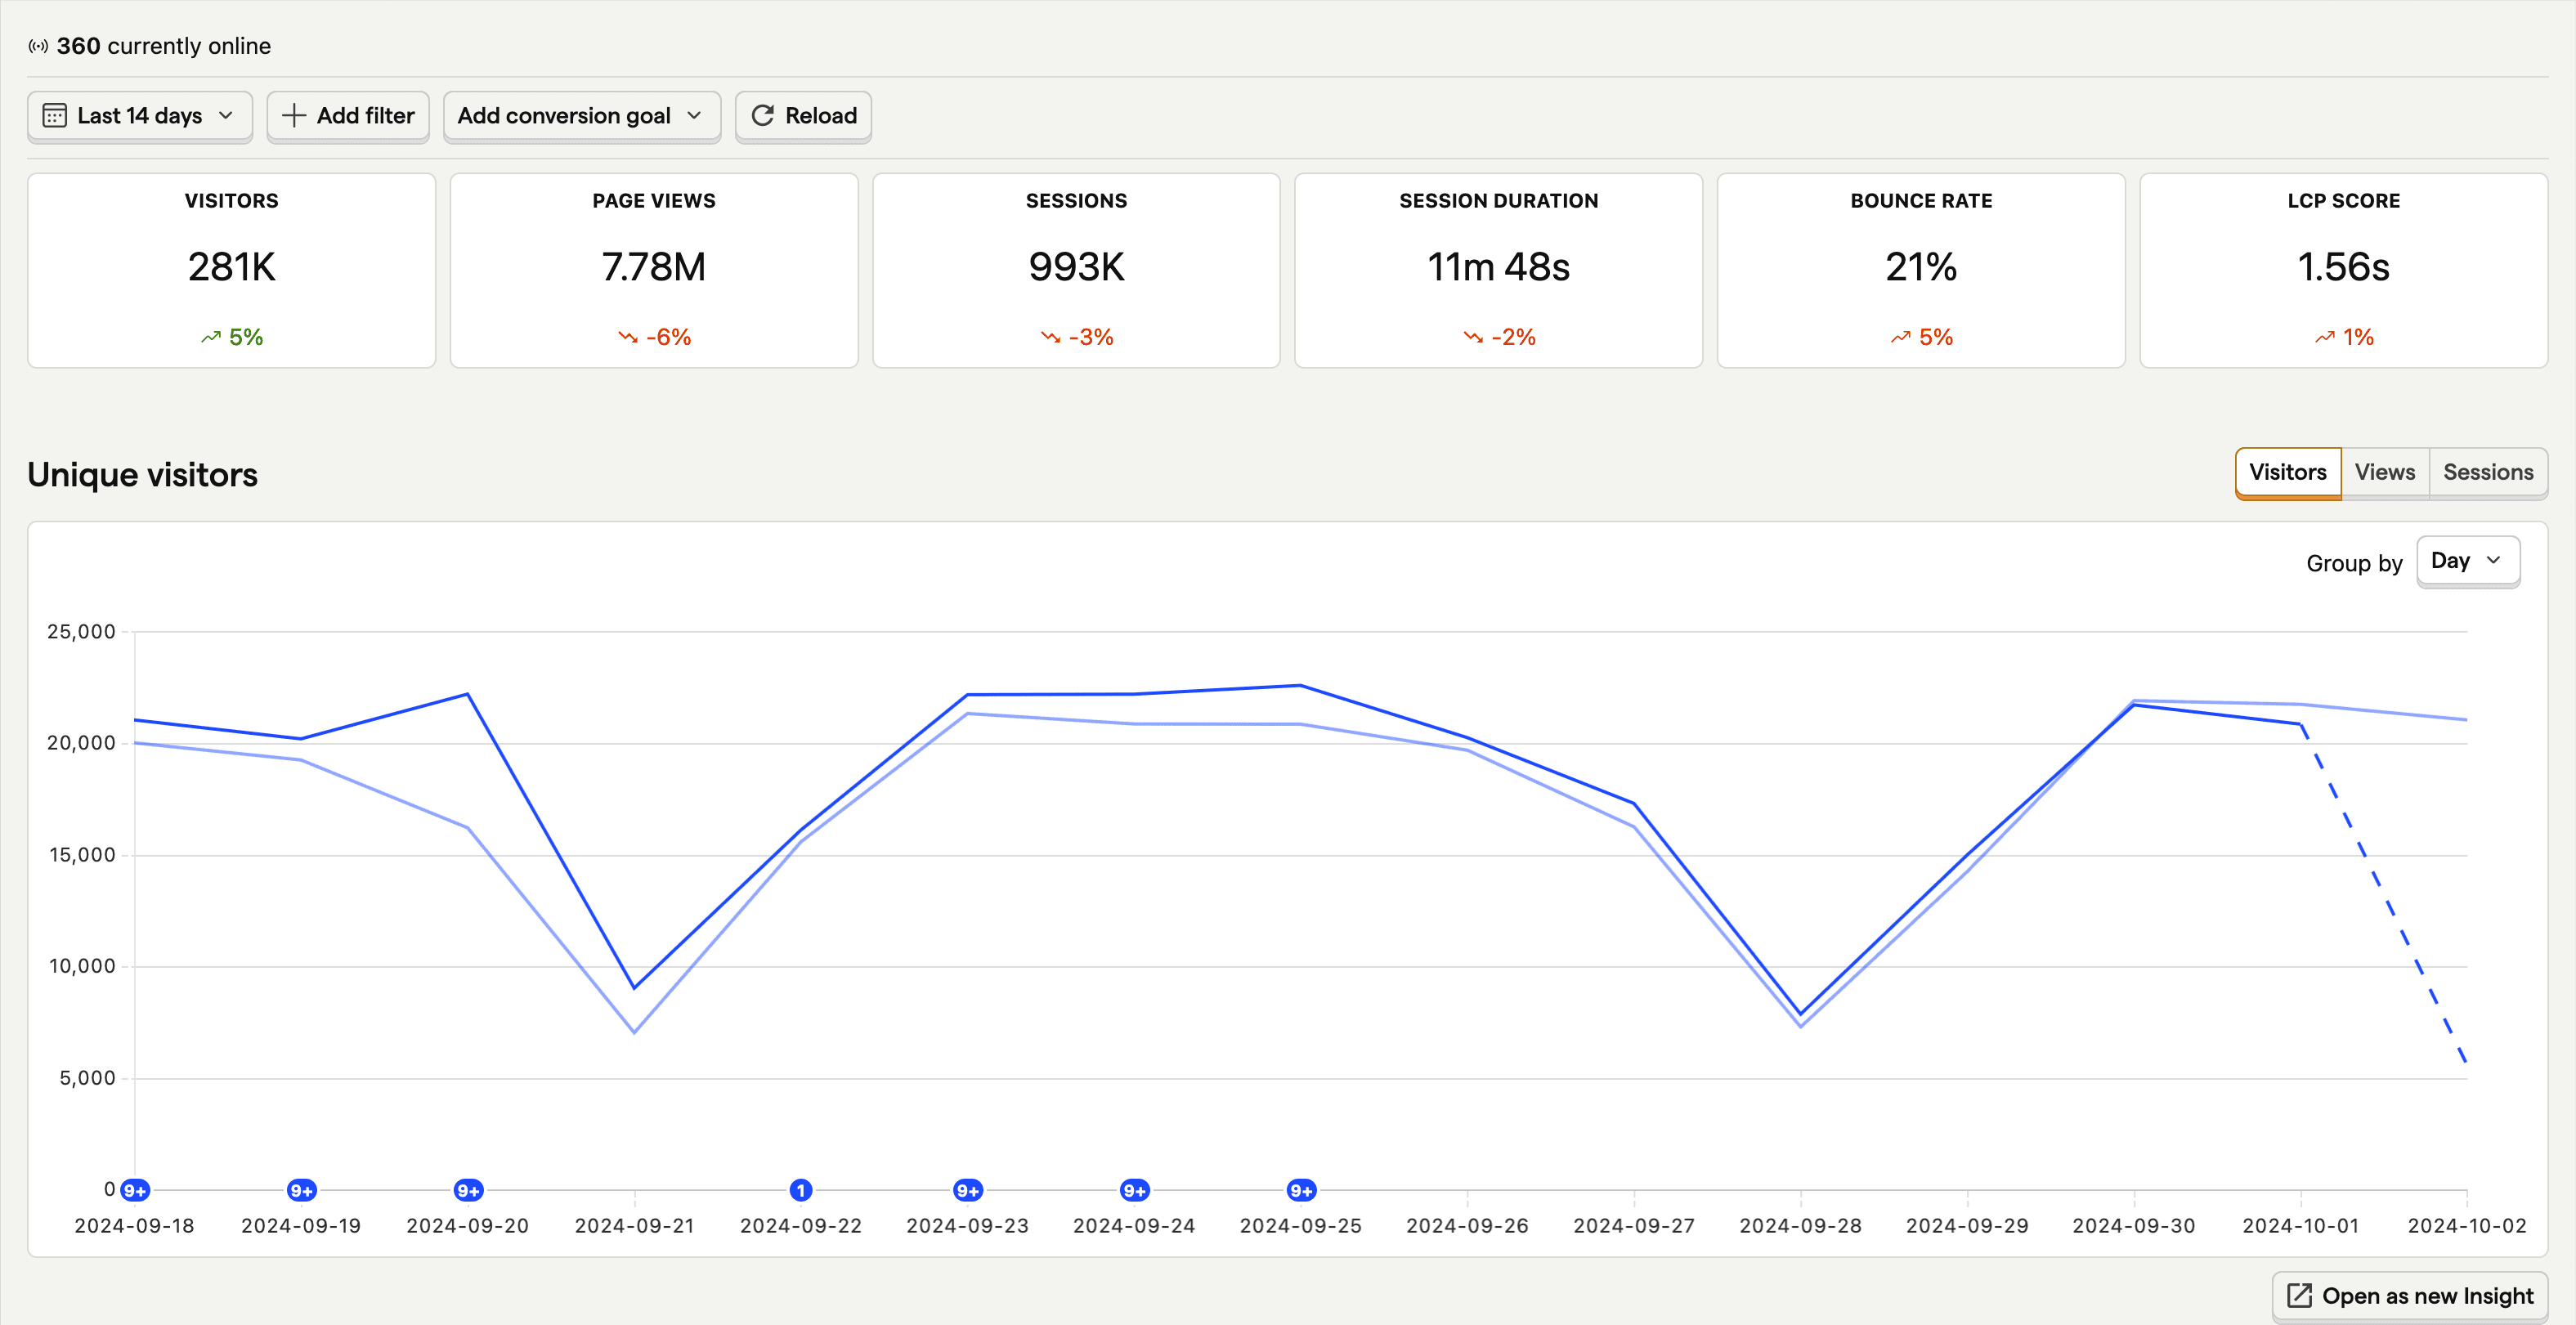
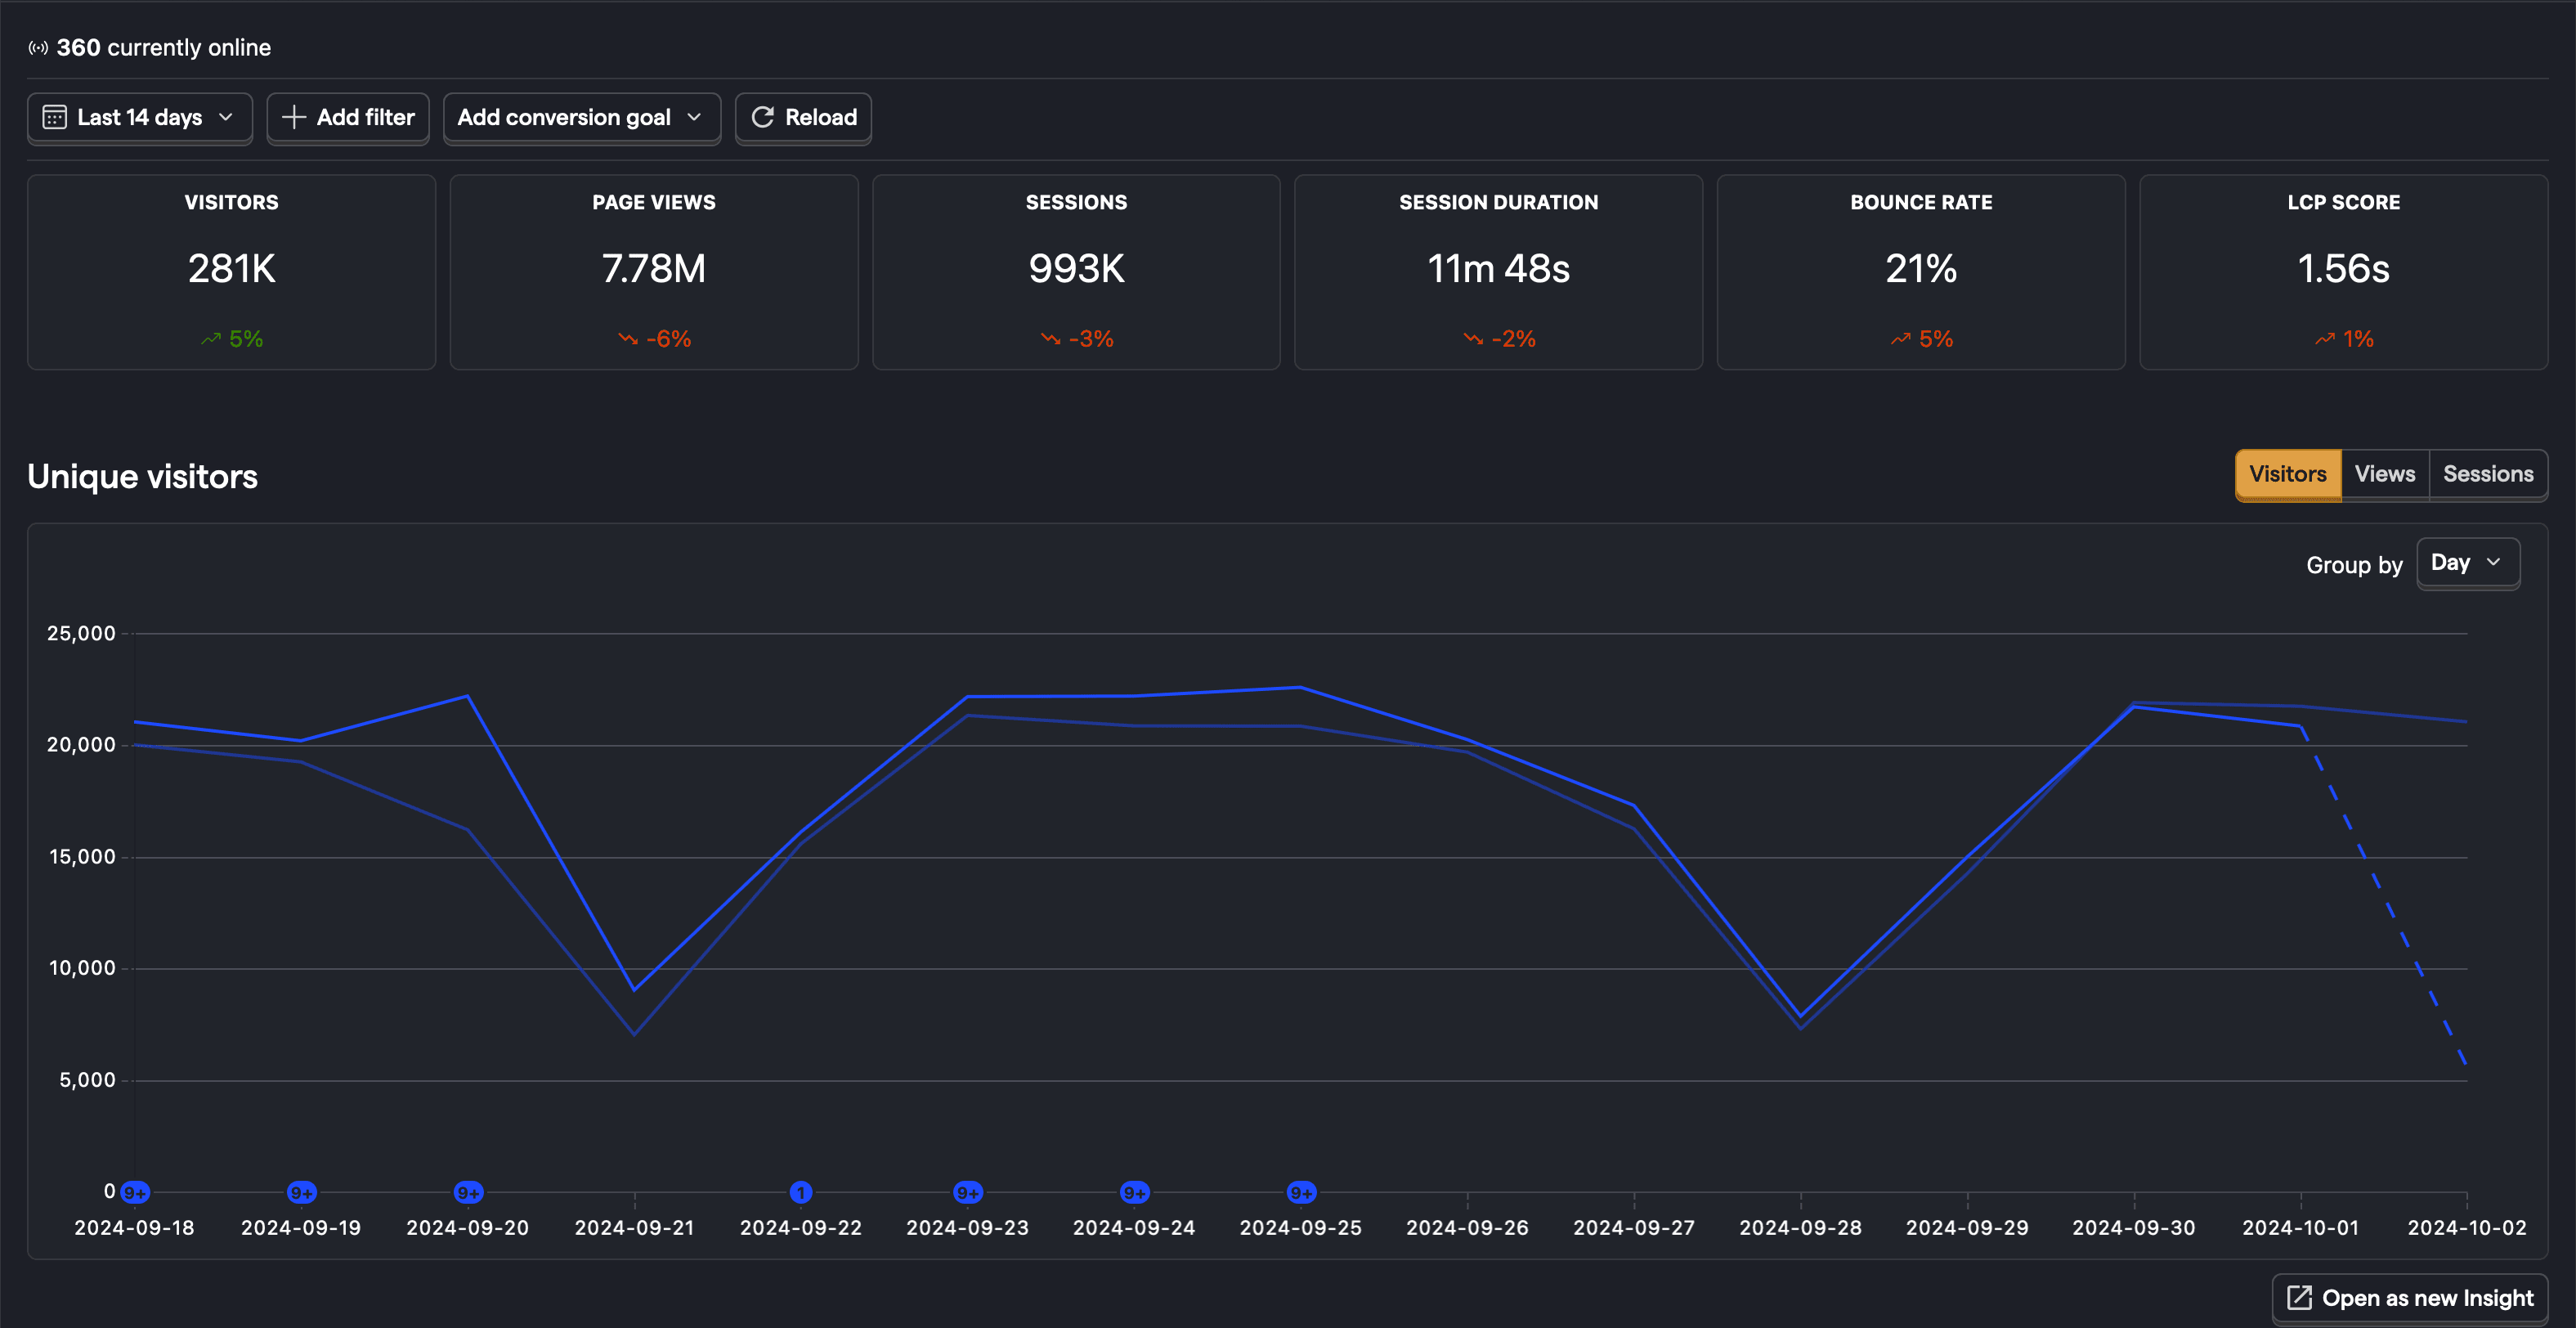
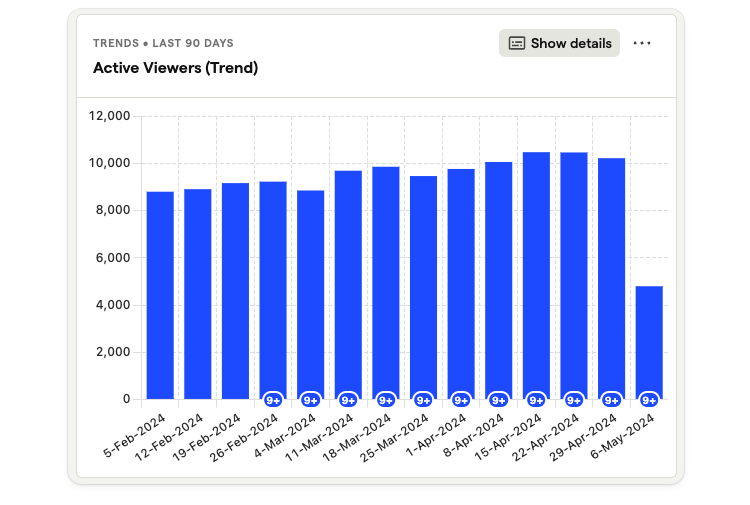
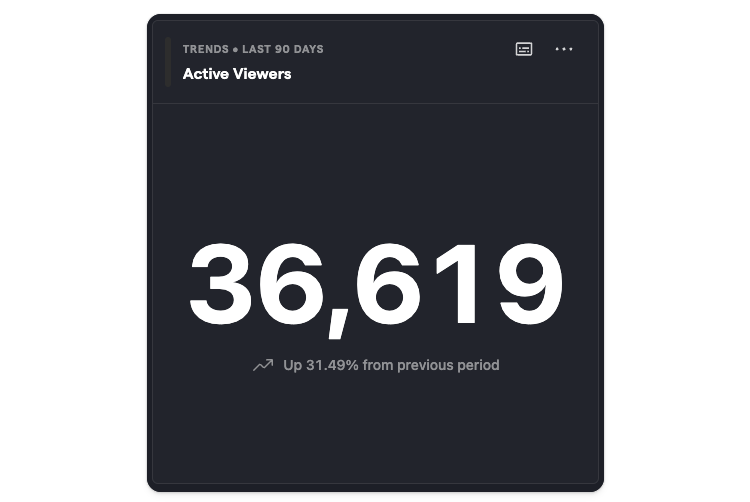
How many visitors were there in recent days, weeks, and months?
Use the web analytics dashboard to see the number of visitors currently online. Or filter by a specific time period like the last 14 days. You can also filter by unique visitors, pageviews, and sessions.
Which pages are people visiting?
Use the paths section on the dashboard to see which paths people are navigating to. You can also filter by the entry path, end path, and outbound clicks.
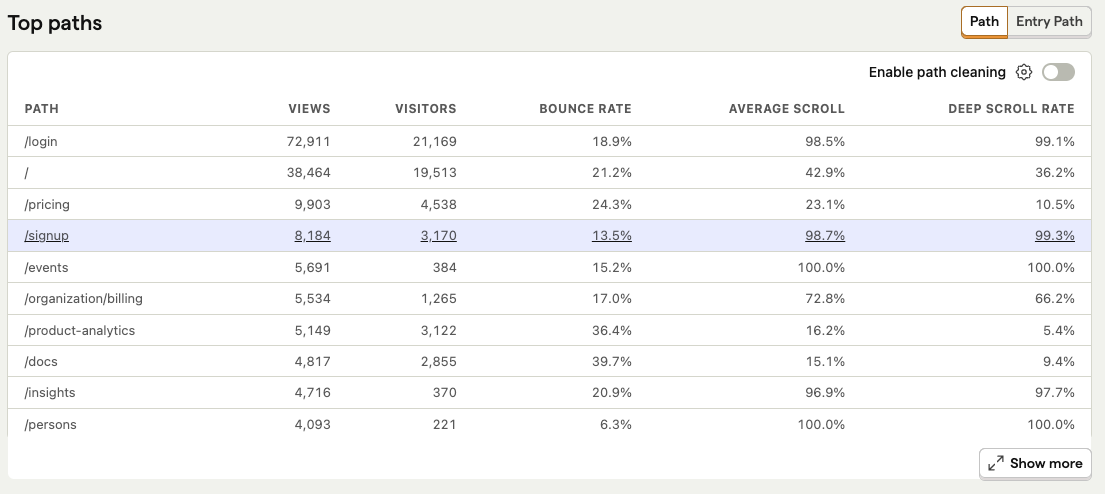
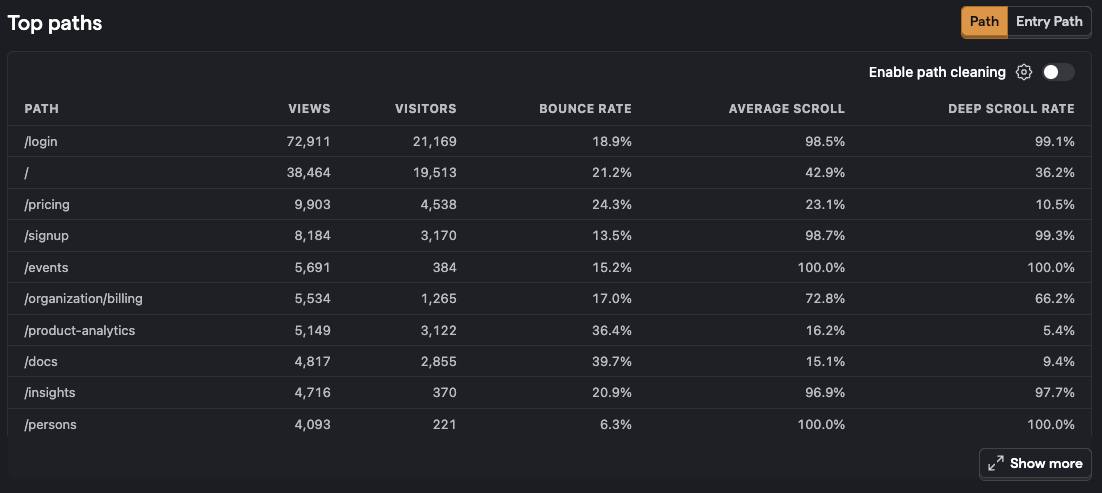
What is the bounce rate for pages on the site?
You can see the bounce rate percentage in the paths section in the web analytics dashboard.
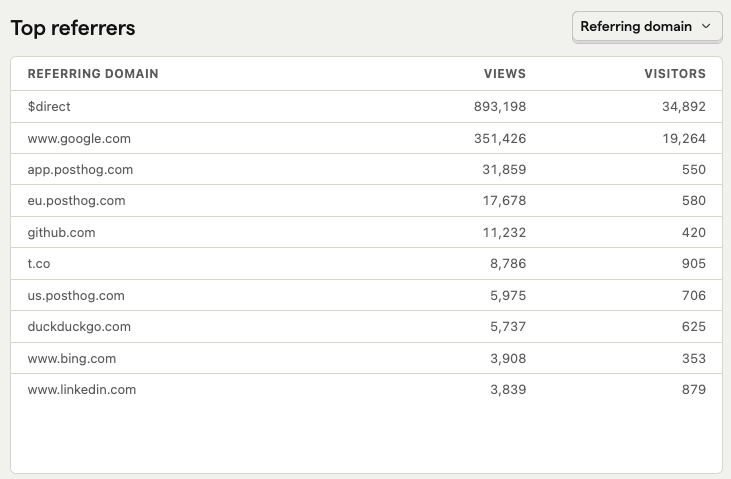
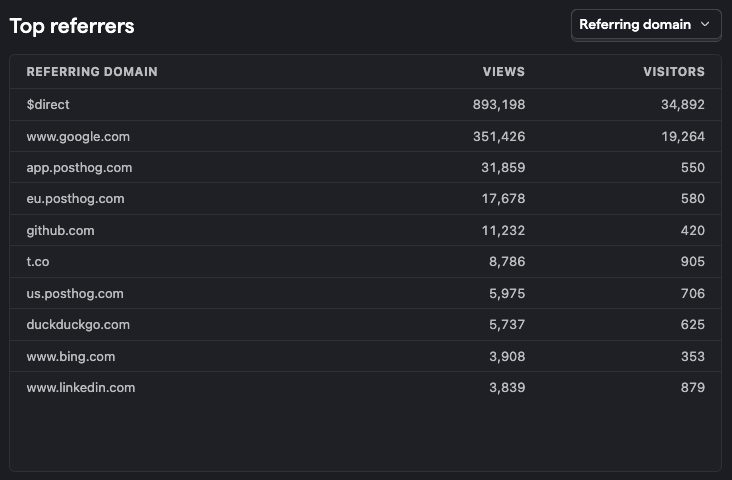
What are the top sources of traffic?
List the top referrers, channels, and UTM sources for the traffic to your website.
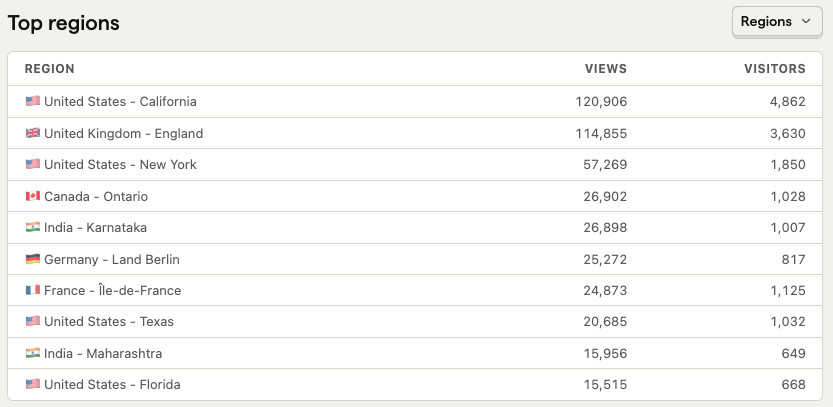
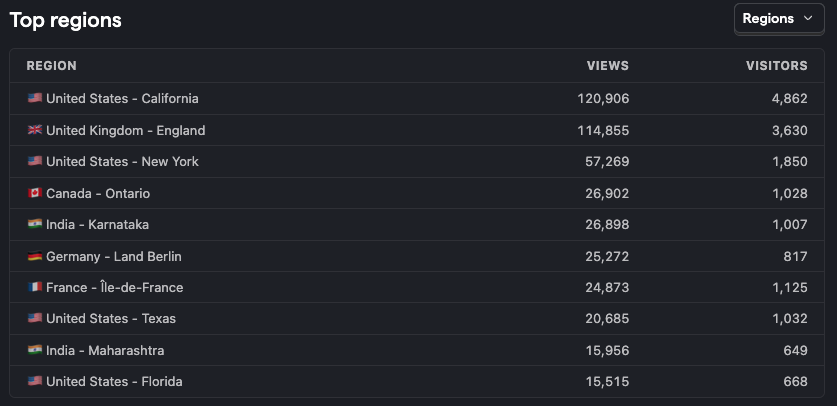
Where are visitors located geographically?
Use the world map to visualize where visitors are located. You can also filter by the top countries, regions, and cities.
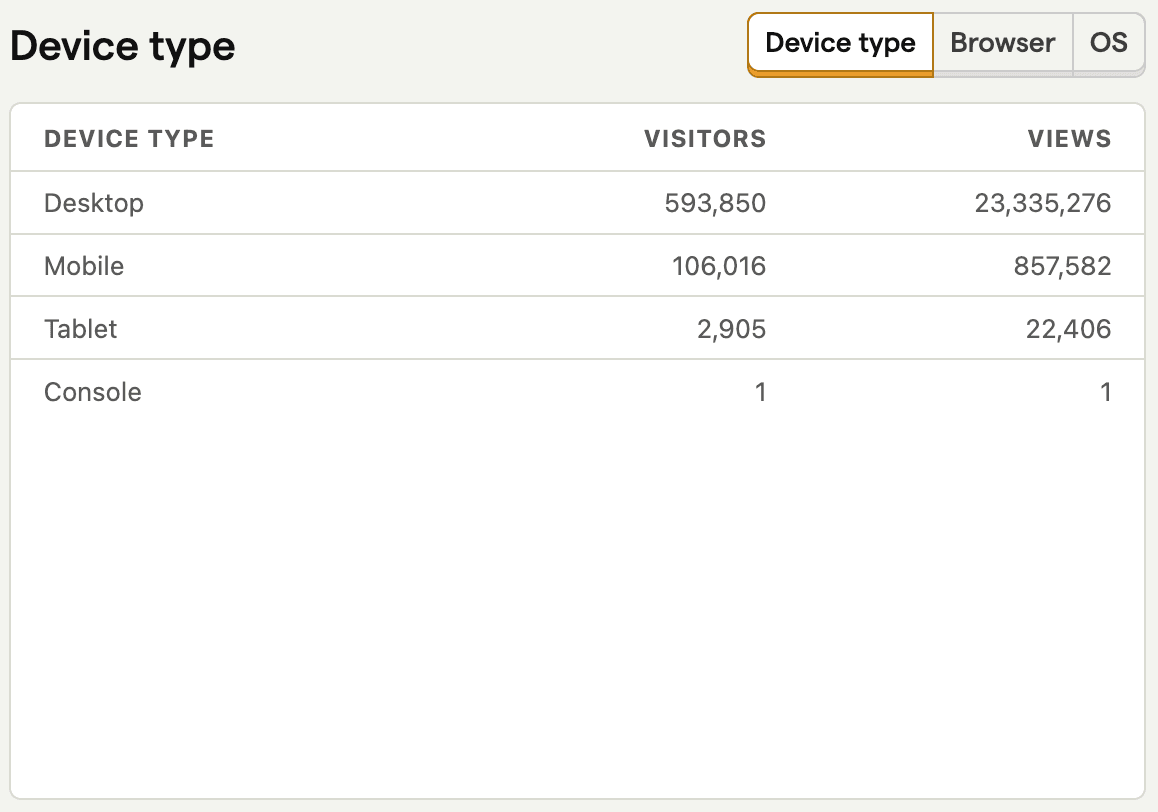
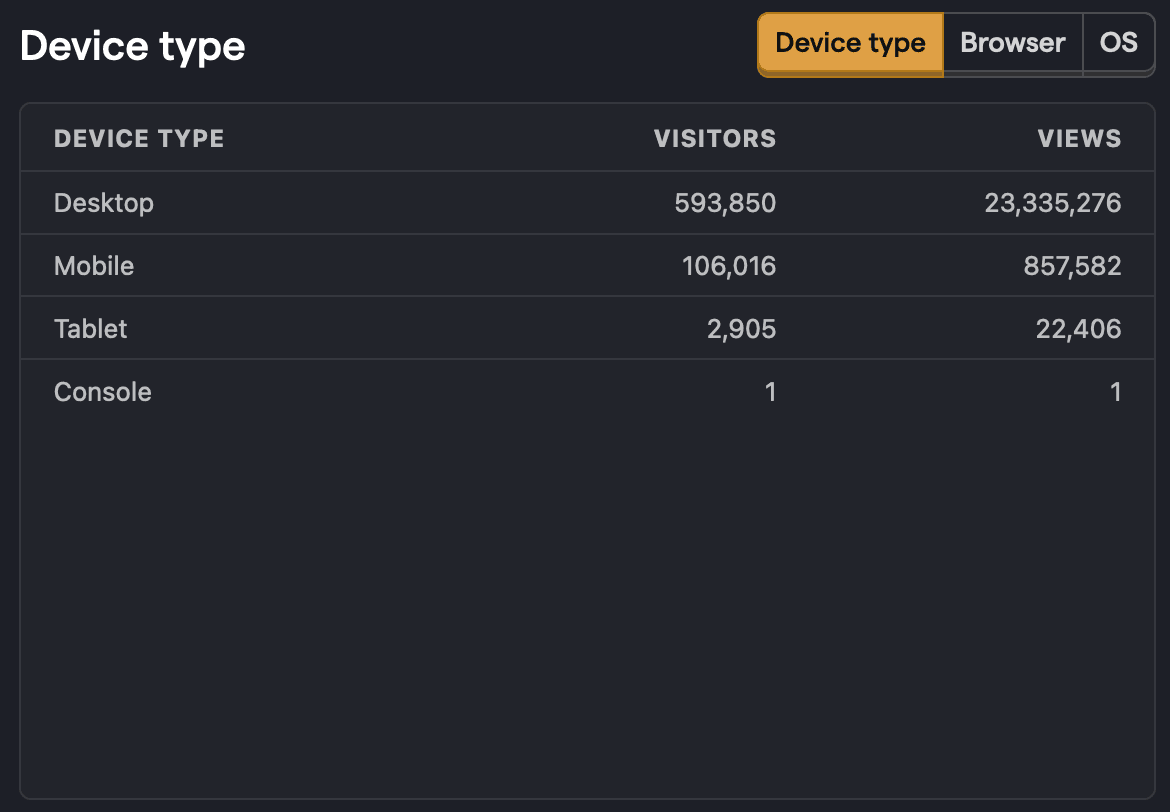
Which device types, browsers, and operating systems are visitors using?
How long do sessions last on average?
You can use the web analytics dashboard to see how long sessions last on average over a given period of time, and also see how that duration is increasing or decreasing from the previous period.
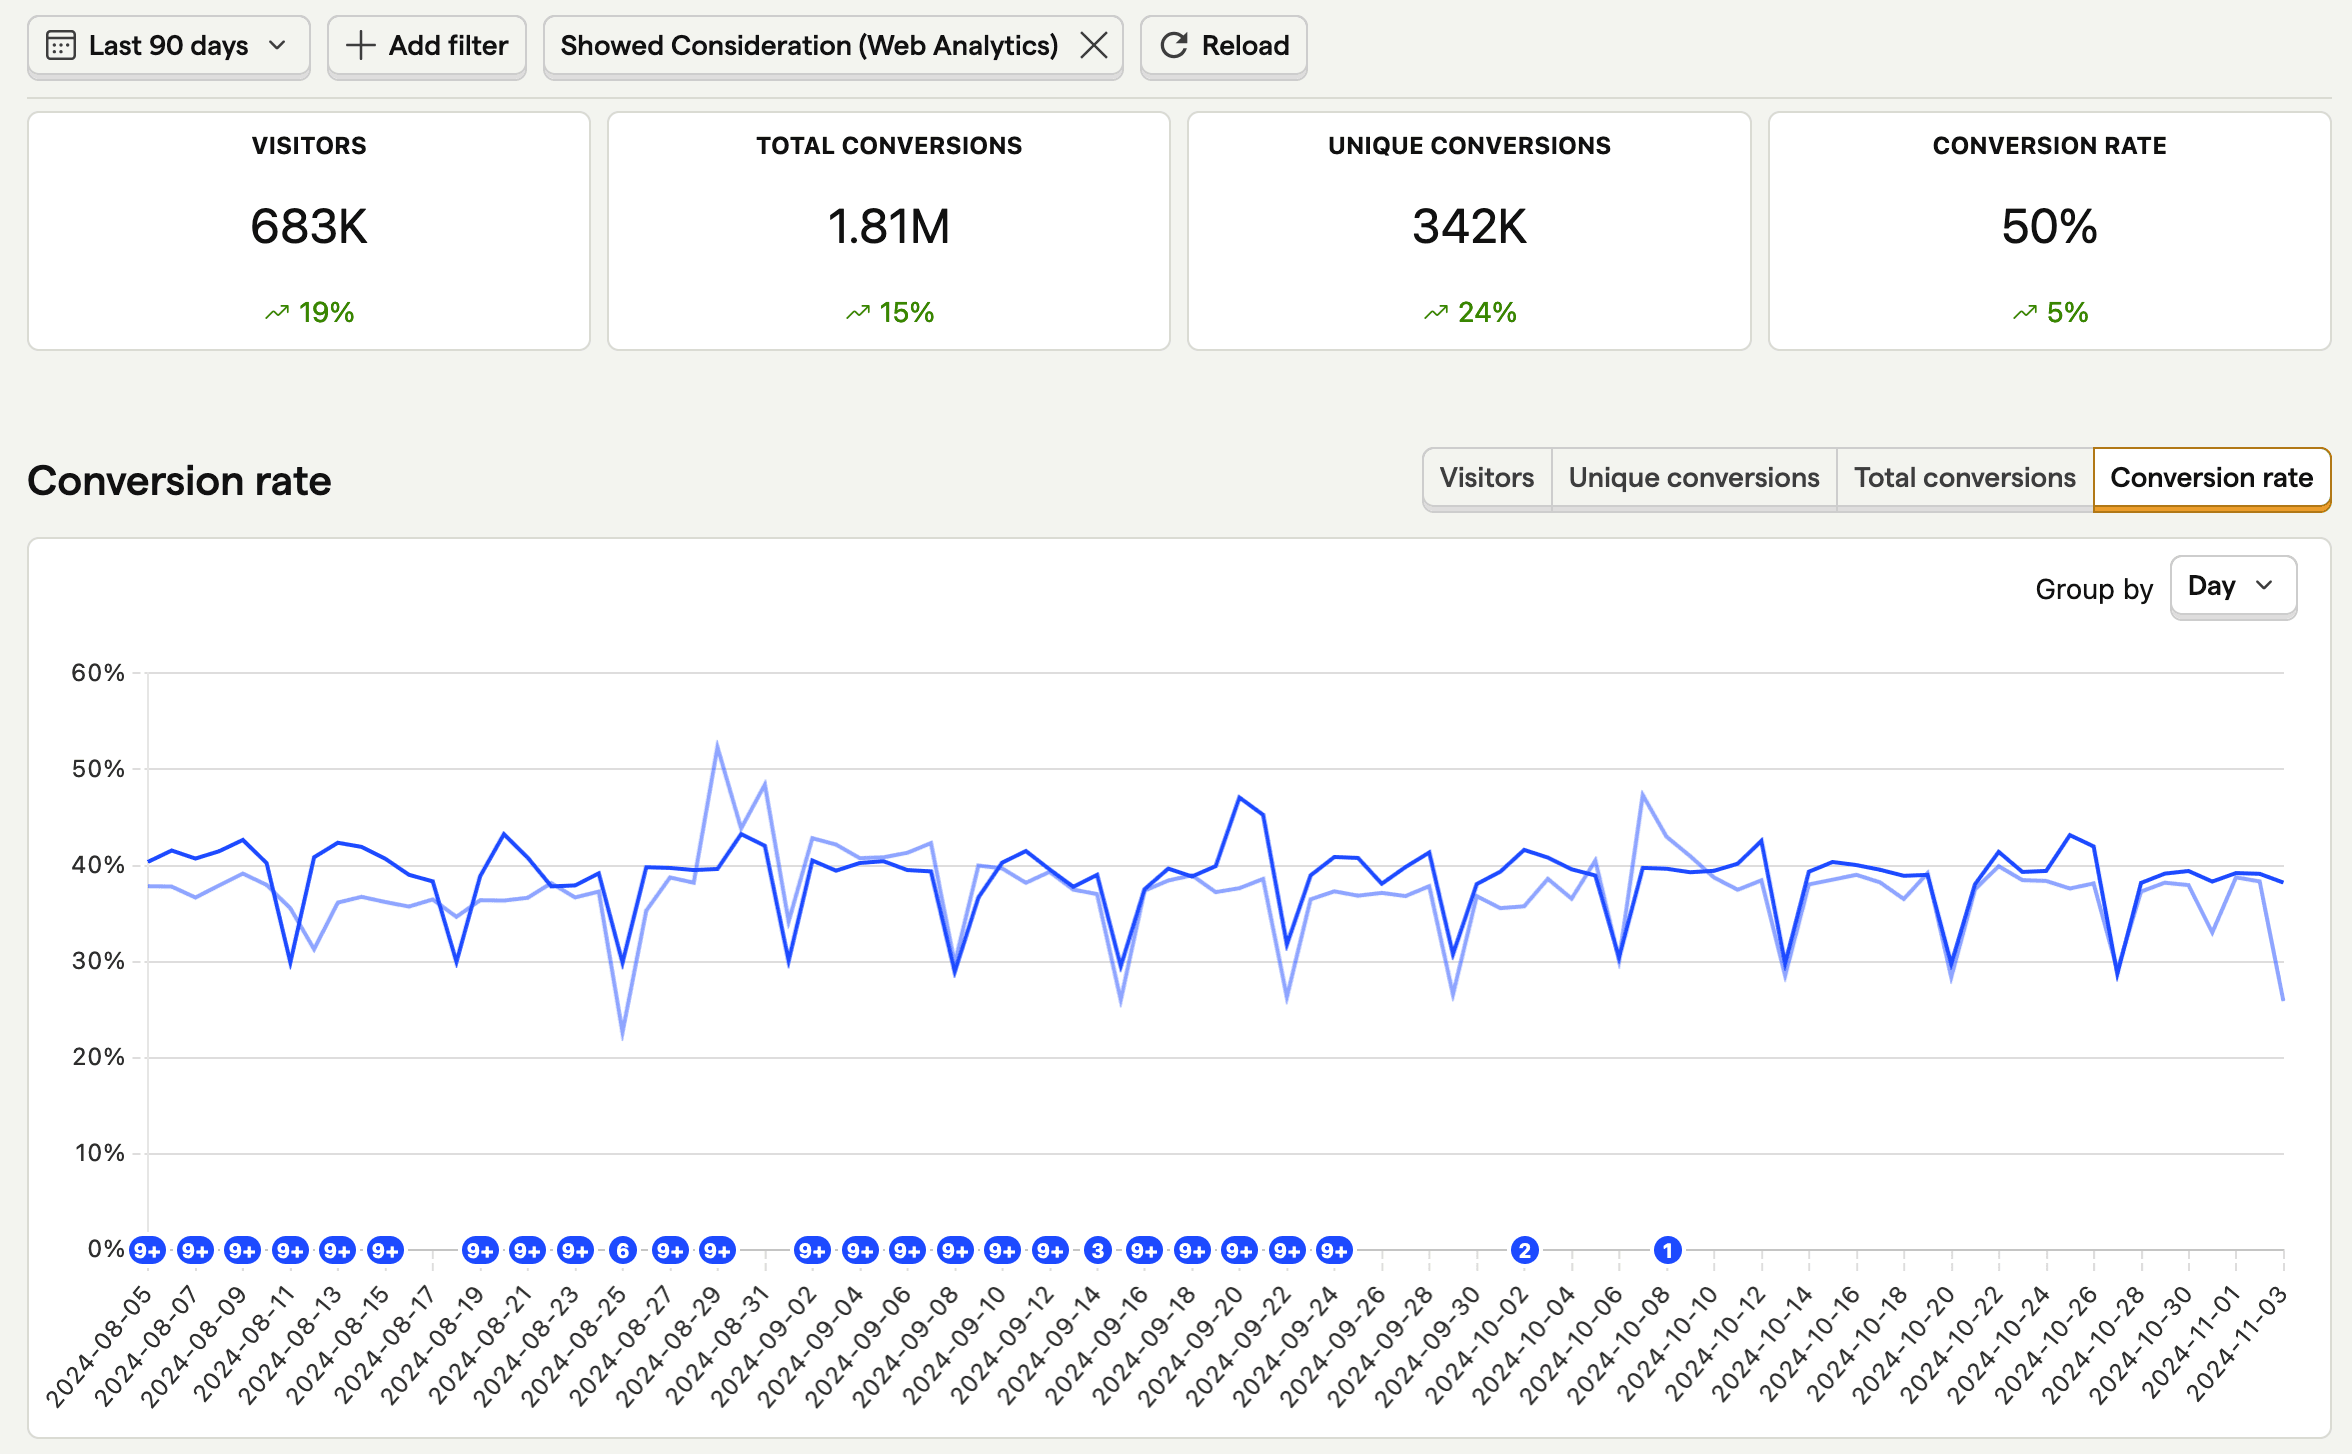
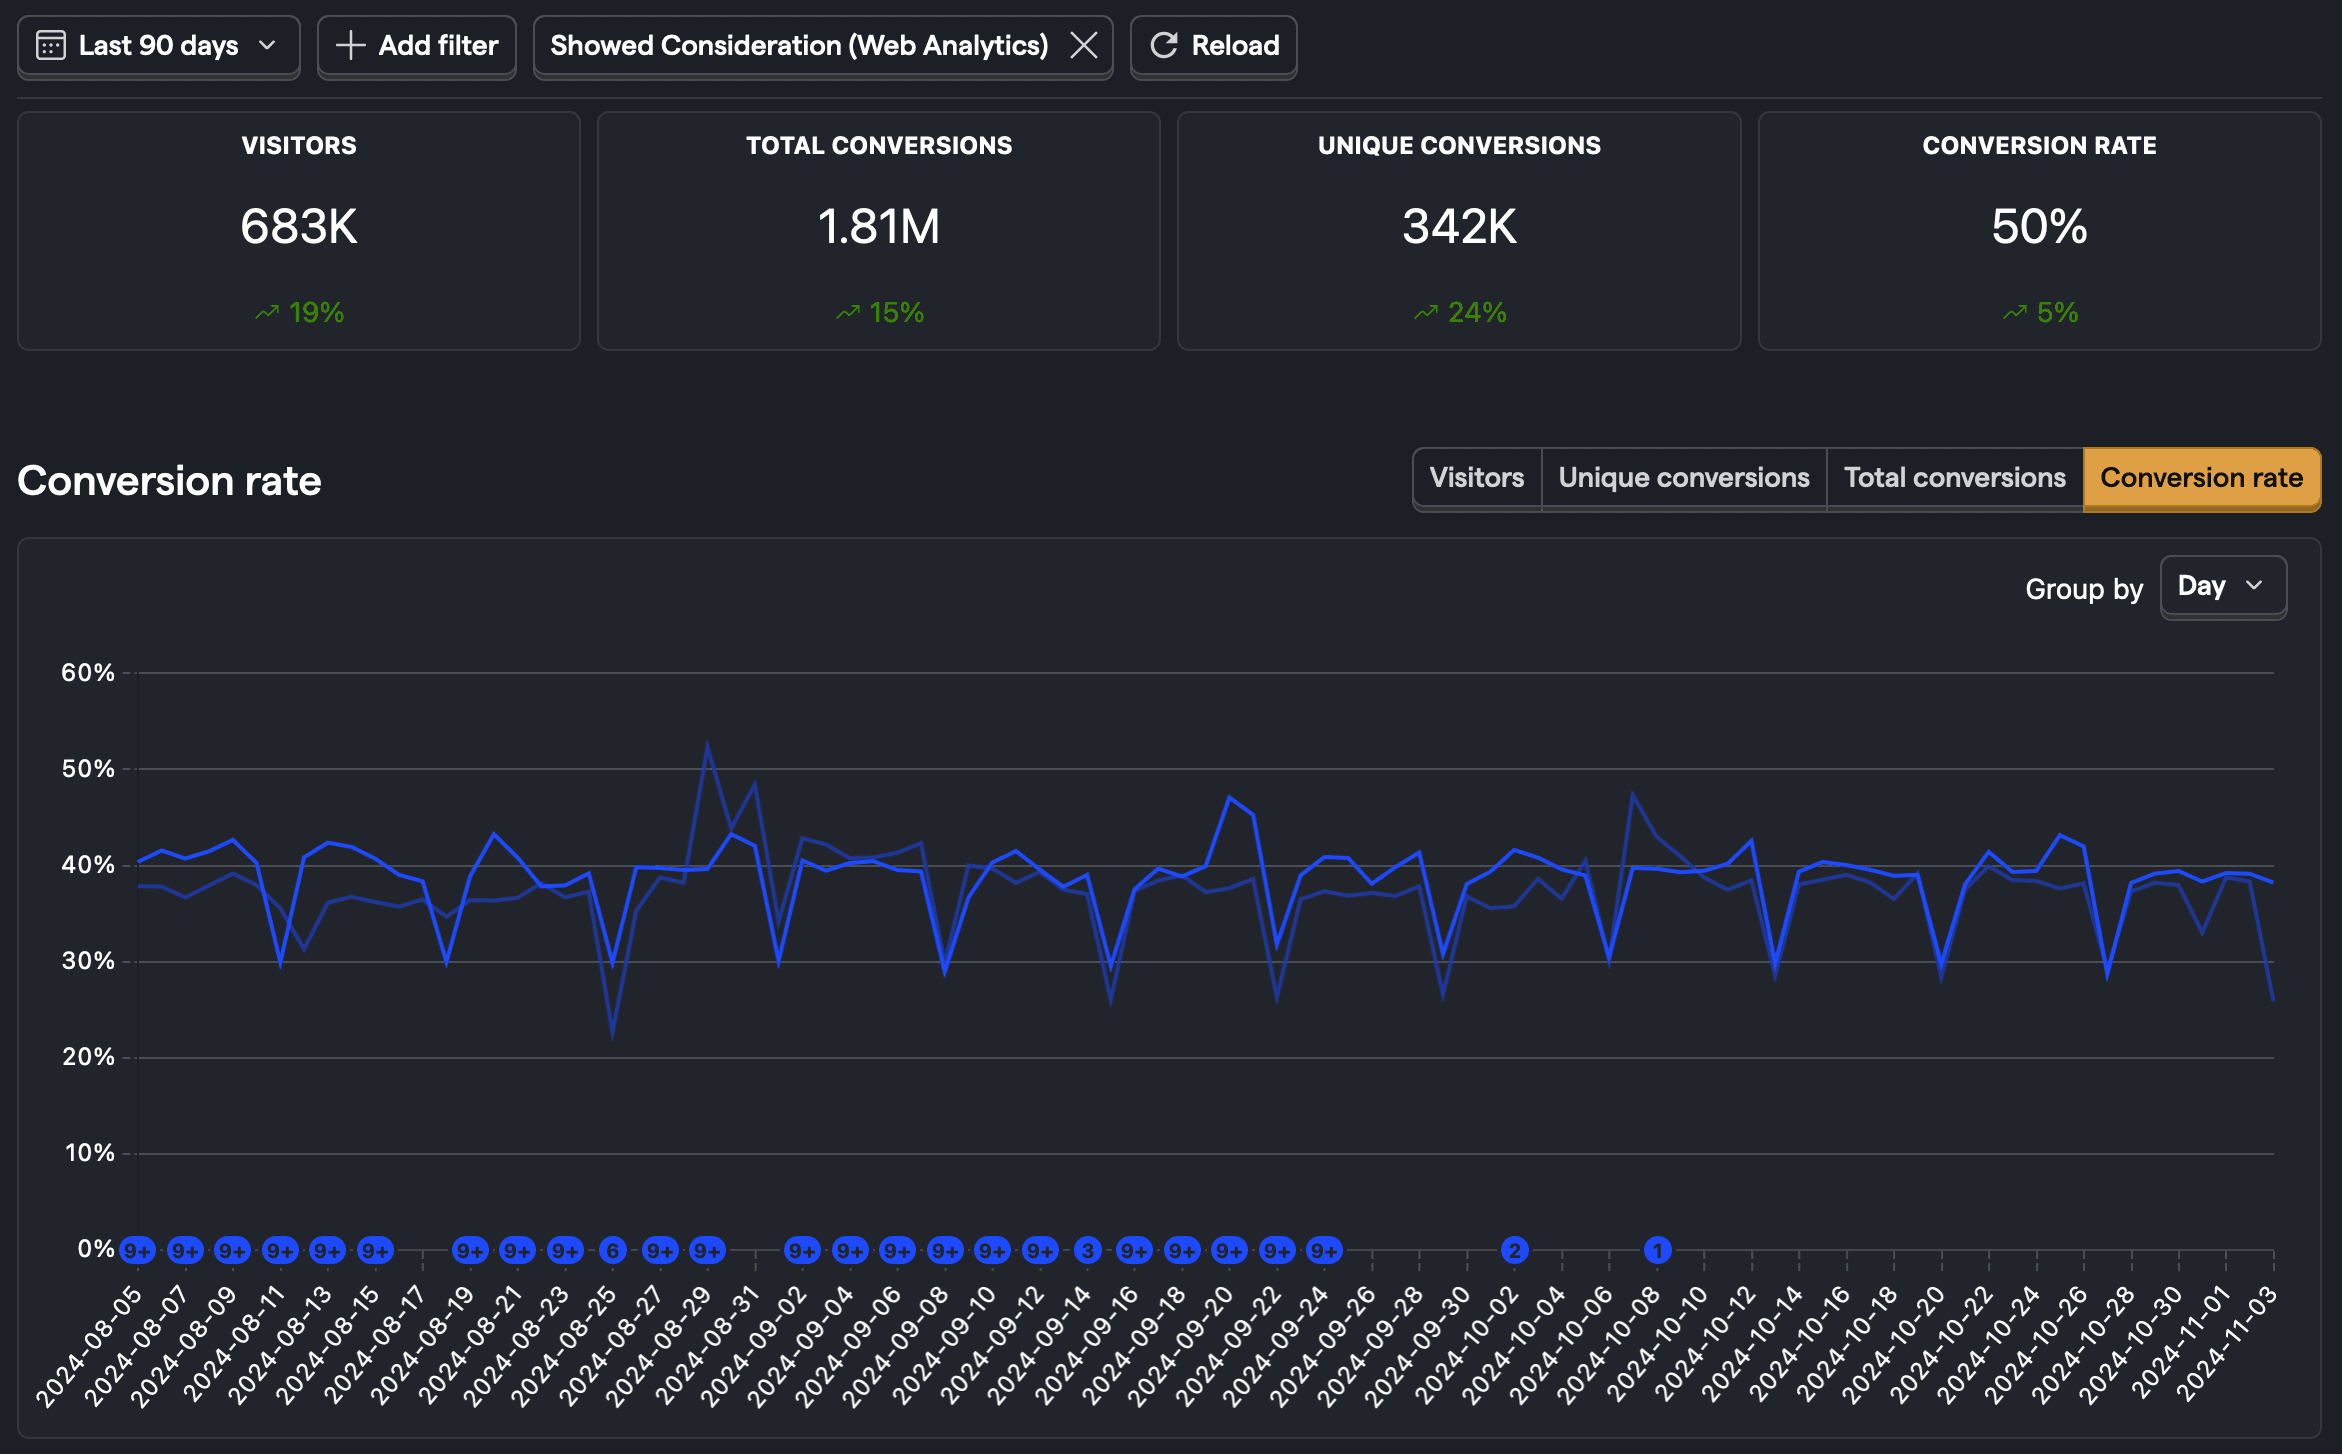
How many people are converting?
Use the Add conversion goal button to view conversion rates for particular events or groups of events.
For more on web analytics, check out our getting started guide.
When should you use product analytics?
When you want to dive deeper into user behavior in your app and how they are interacting with features. It gives you insights into metrics such as feature adoption rate, user retention, and churn.
You can use product analytics to:
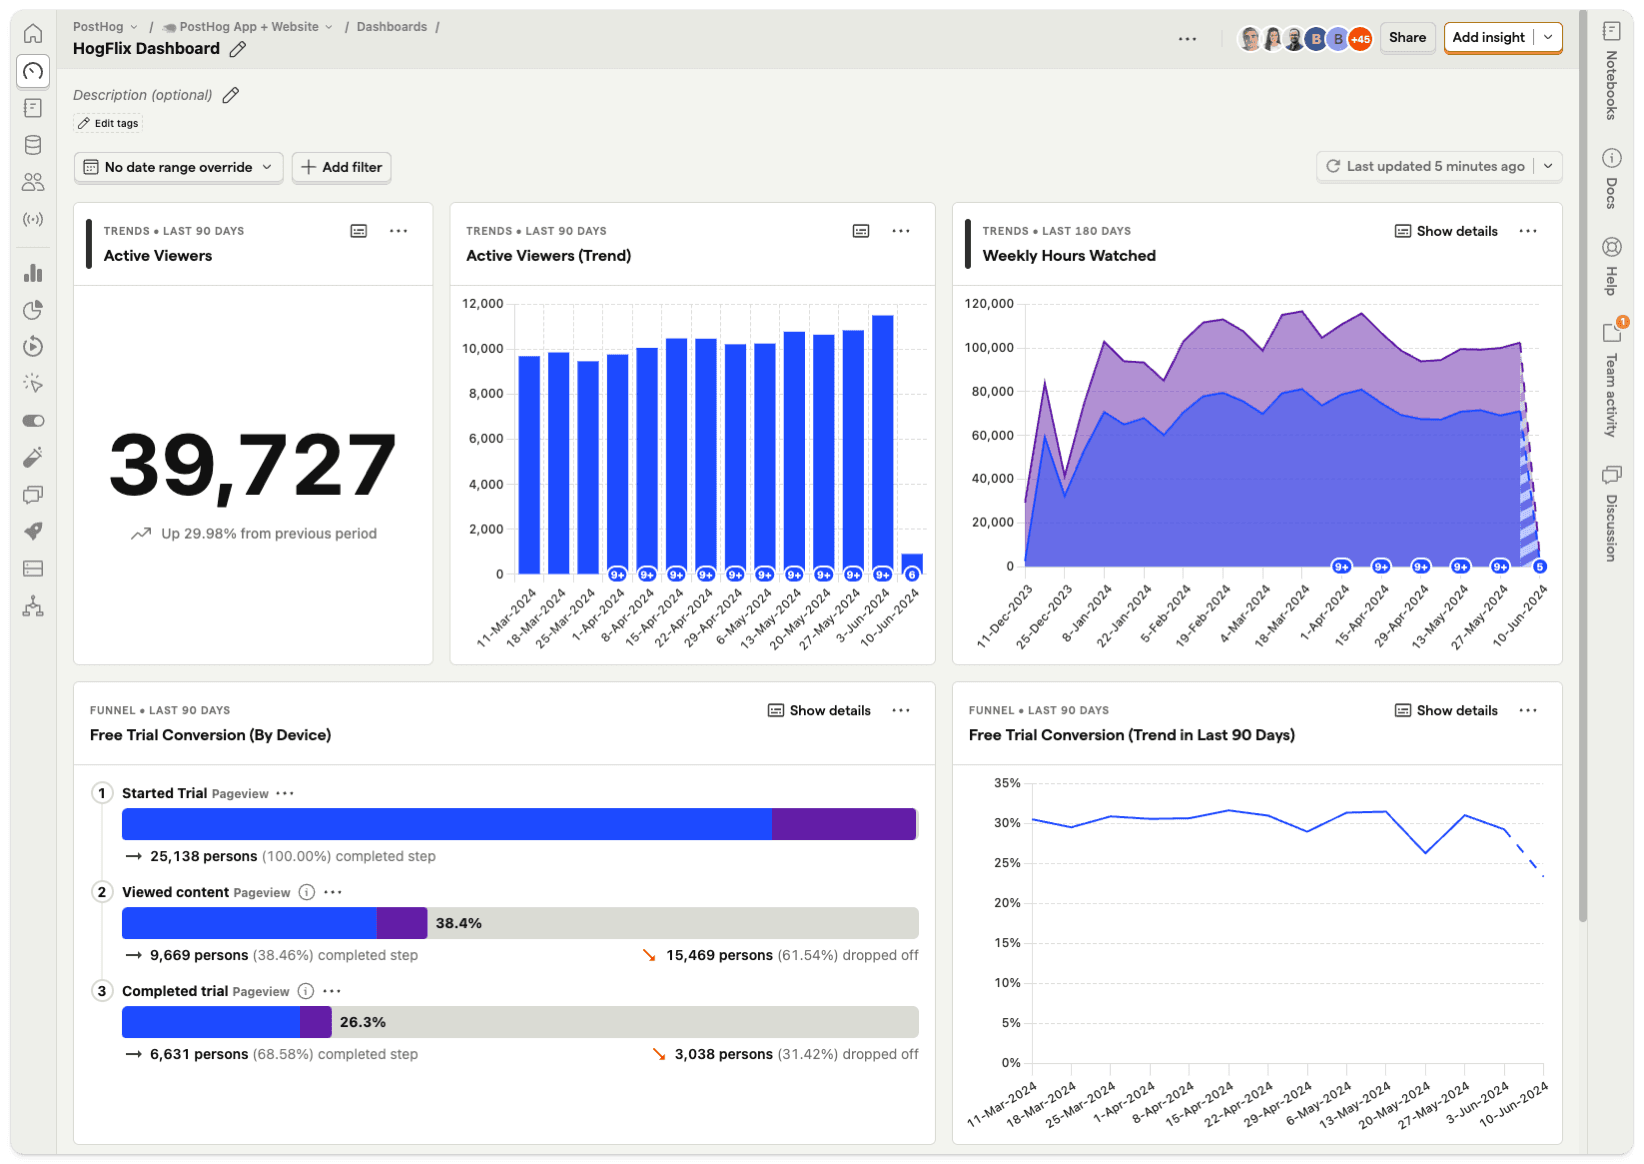
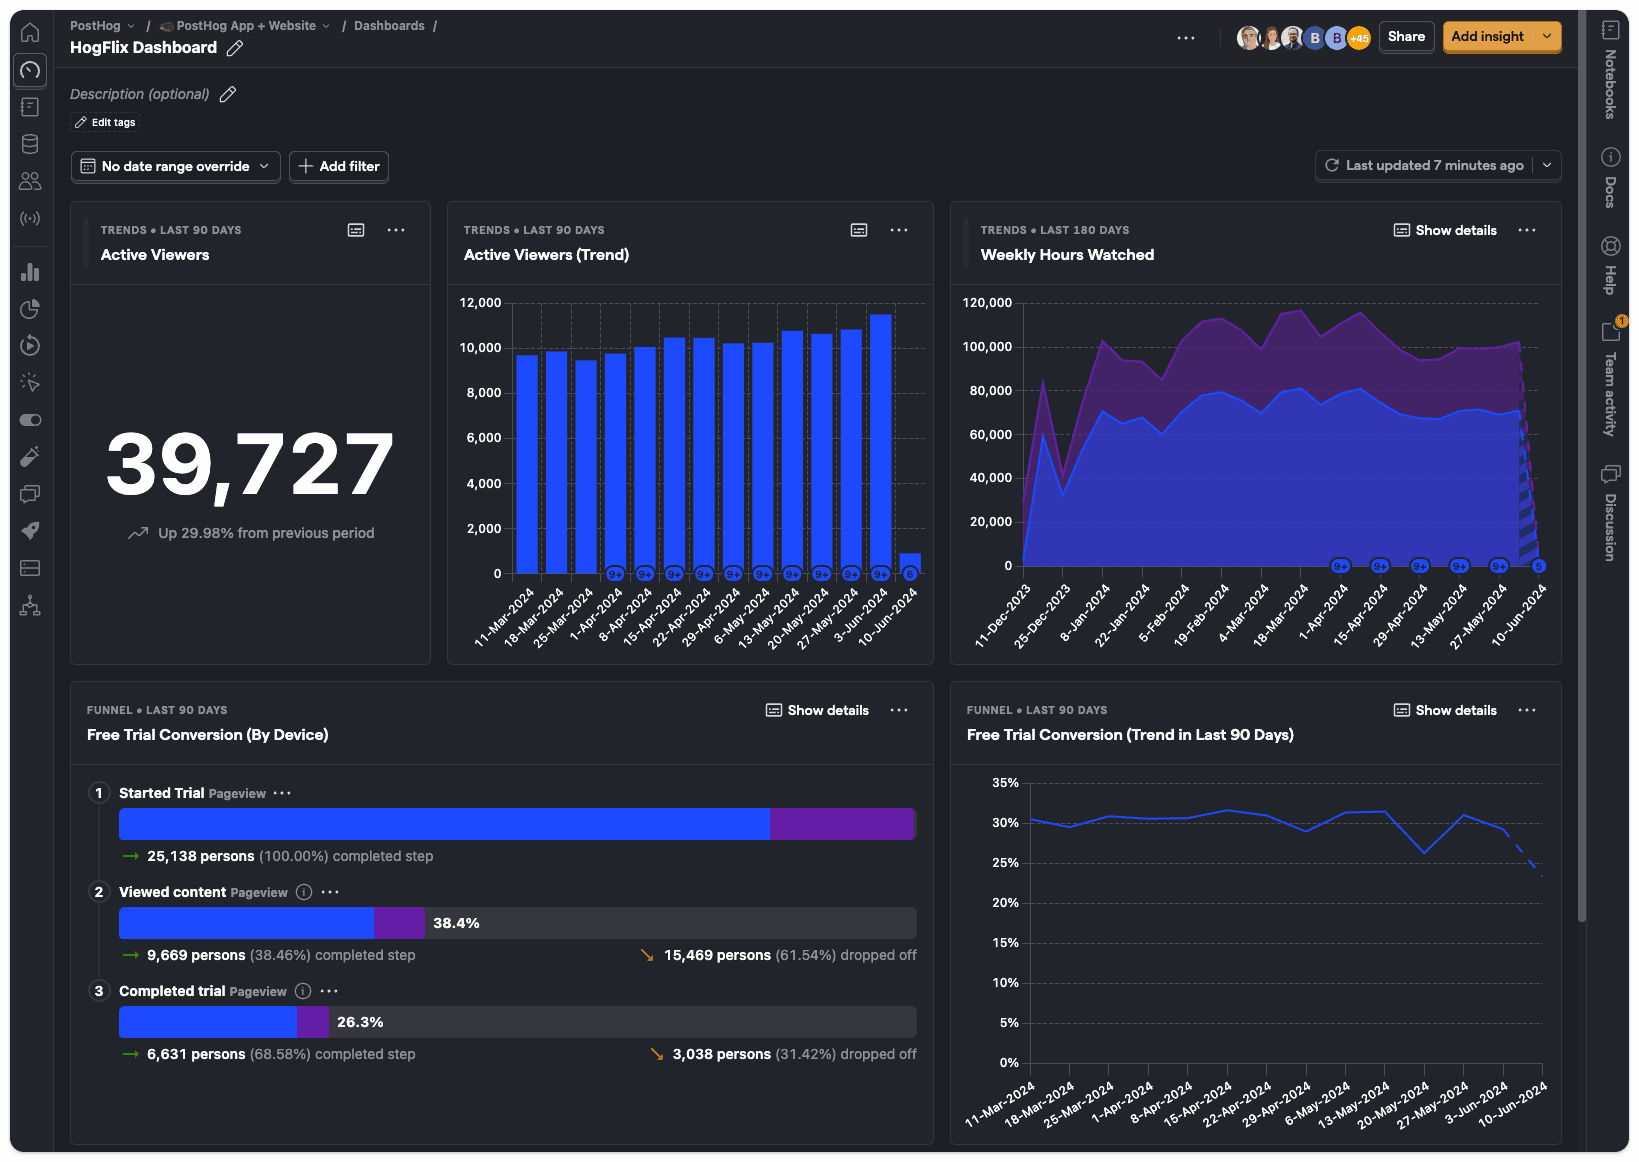
Build custom dashboards
You can create custom dashboards to track all your most important product and performance metrics.
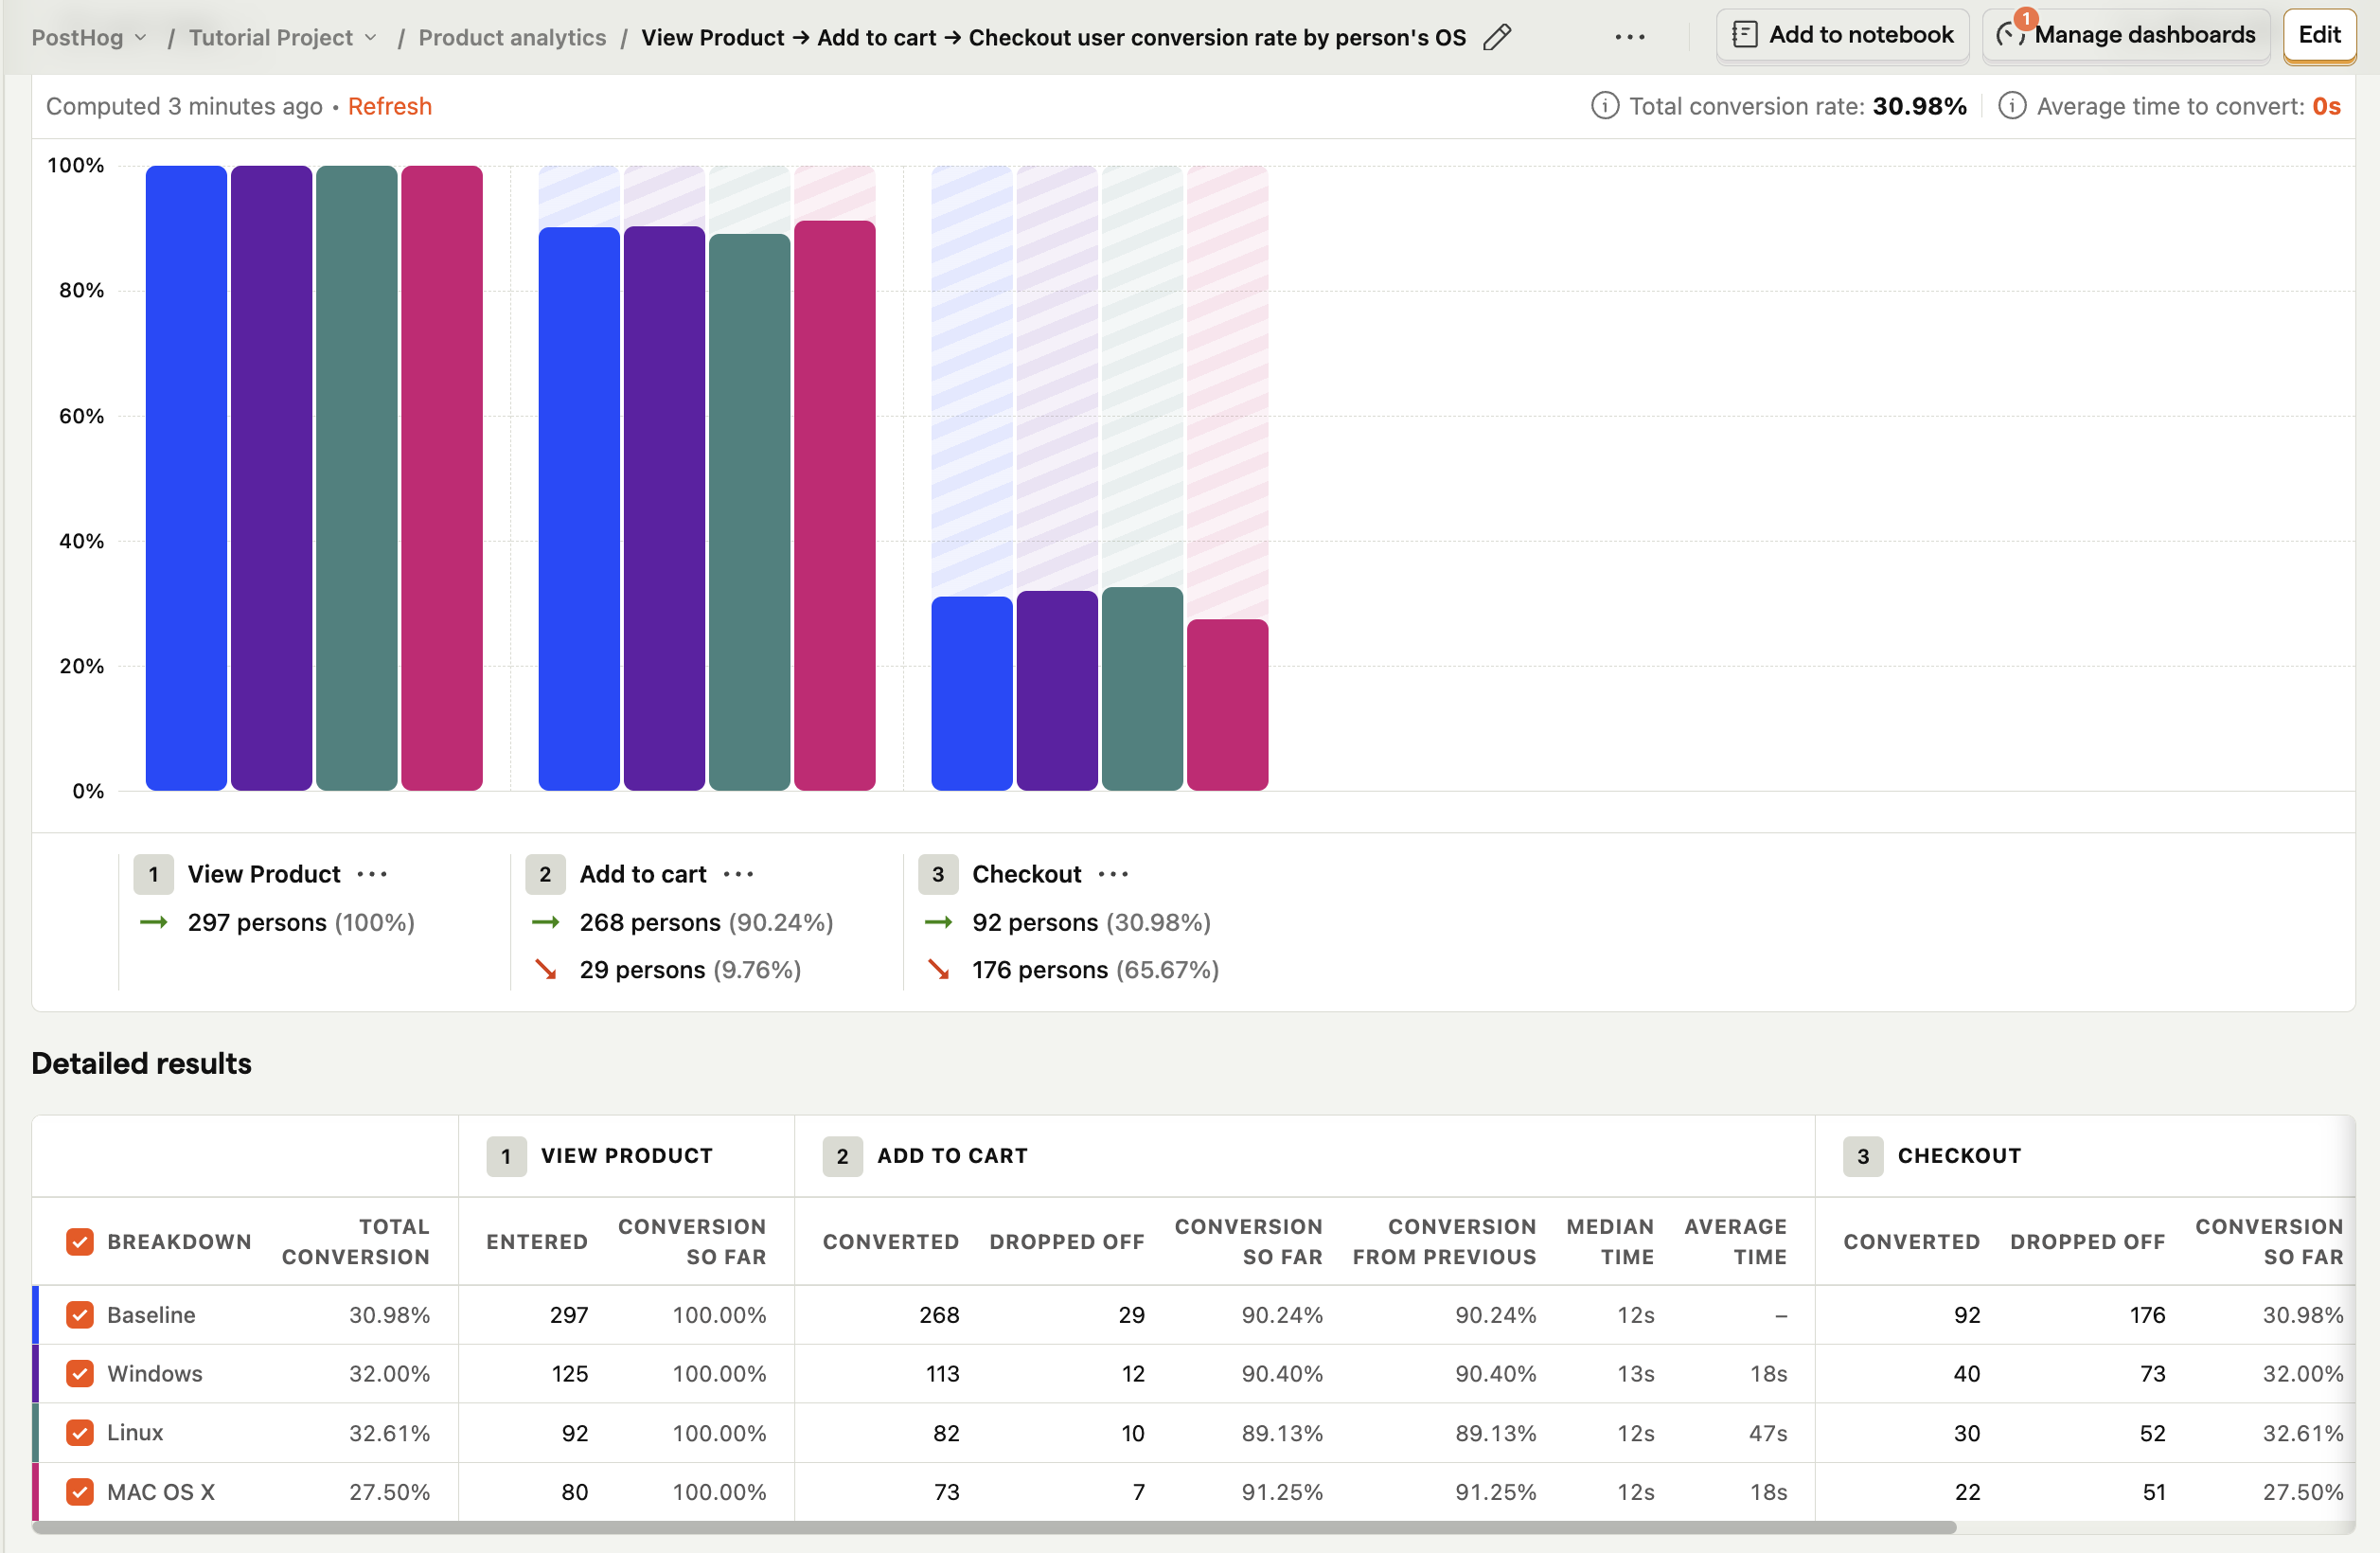
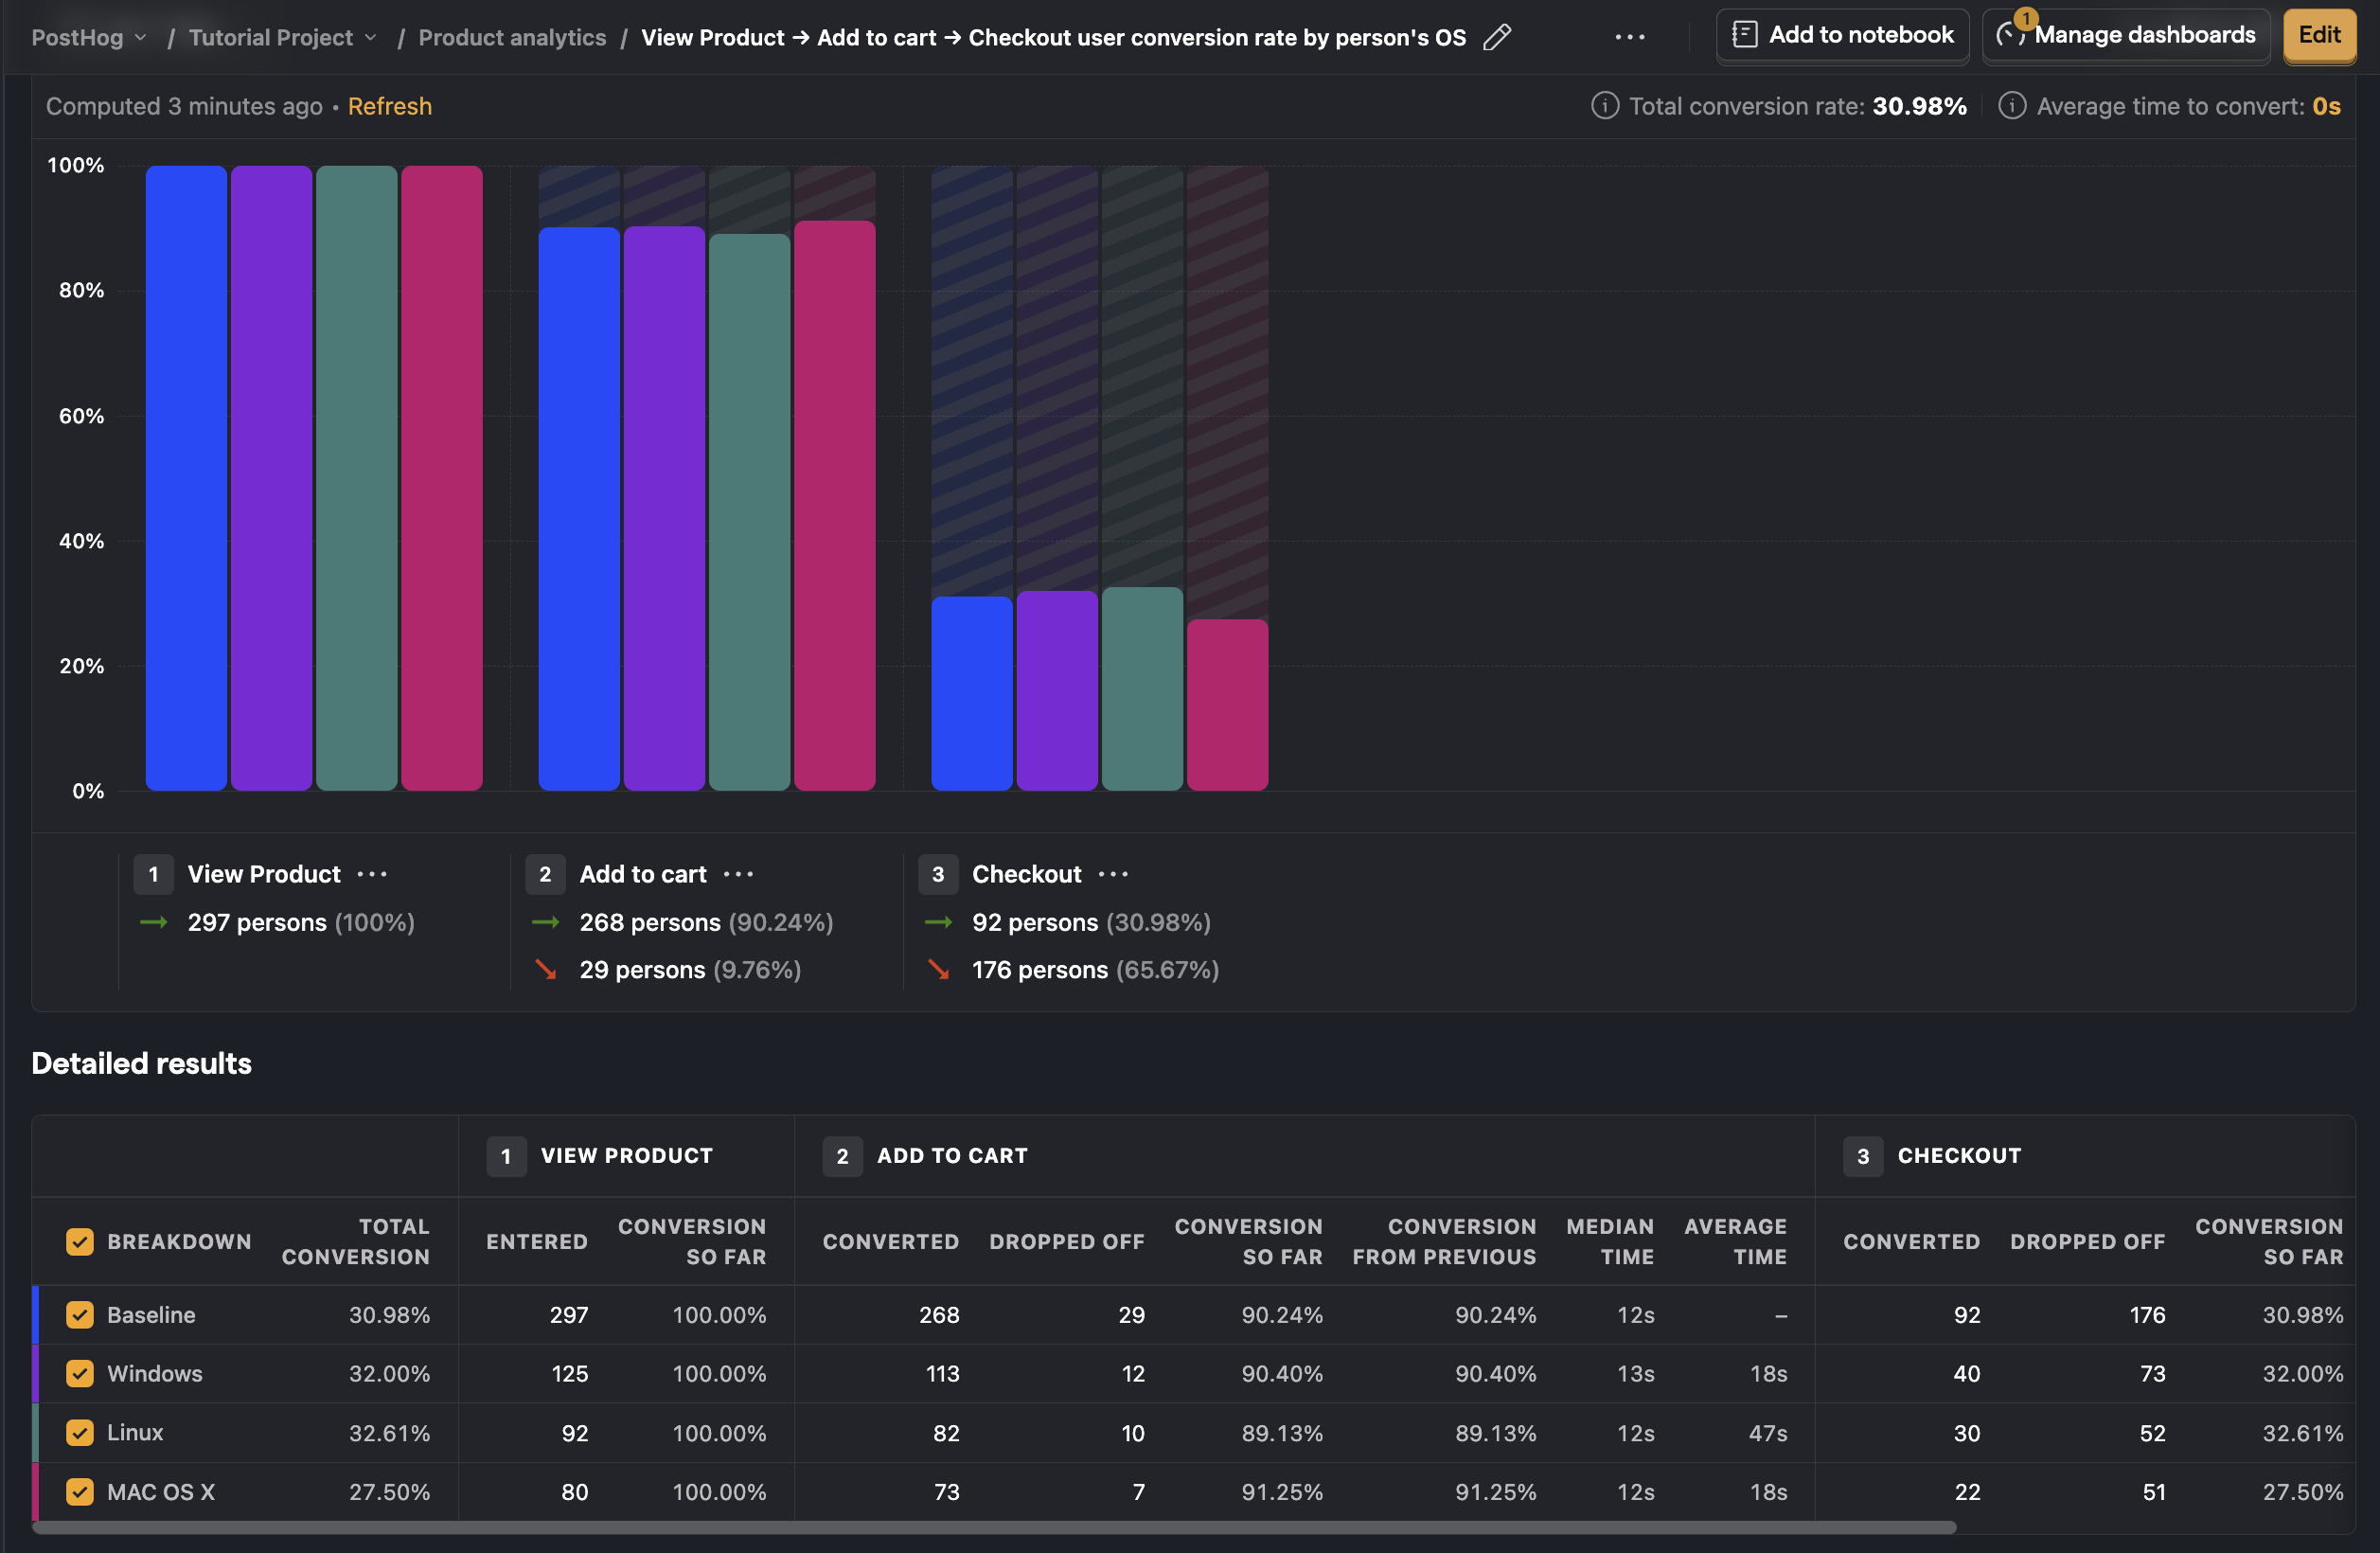
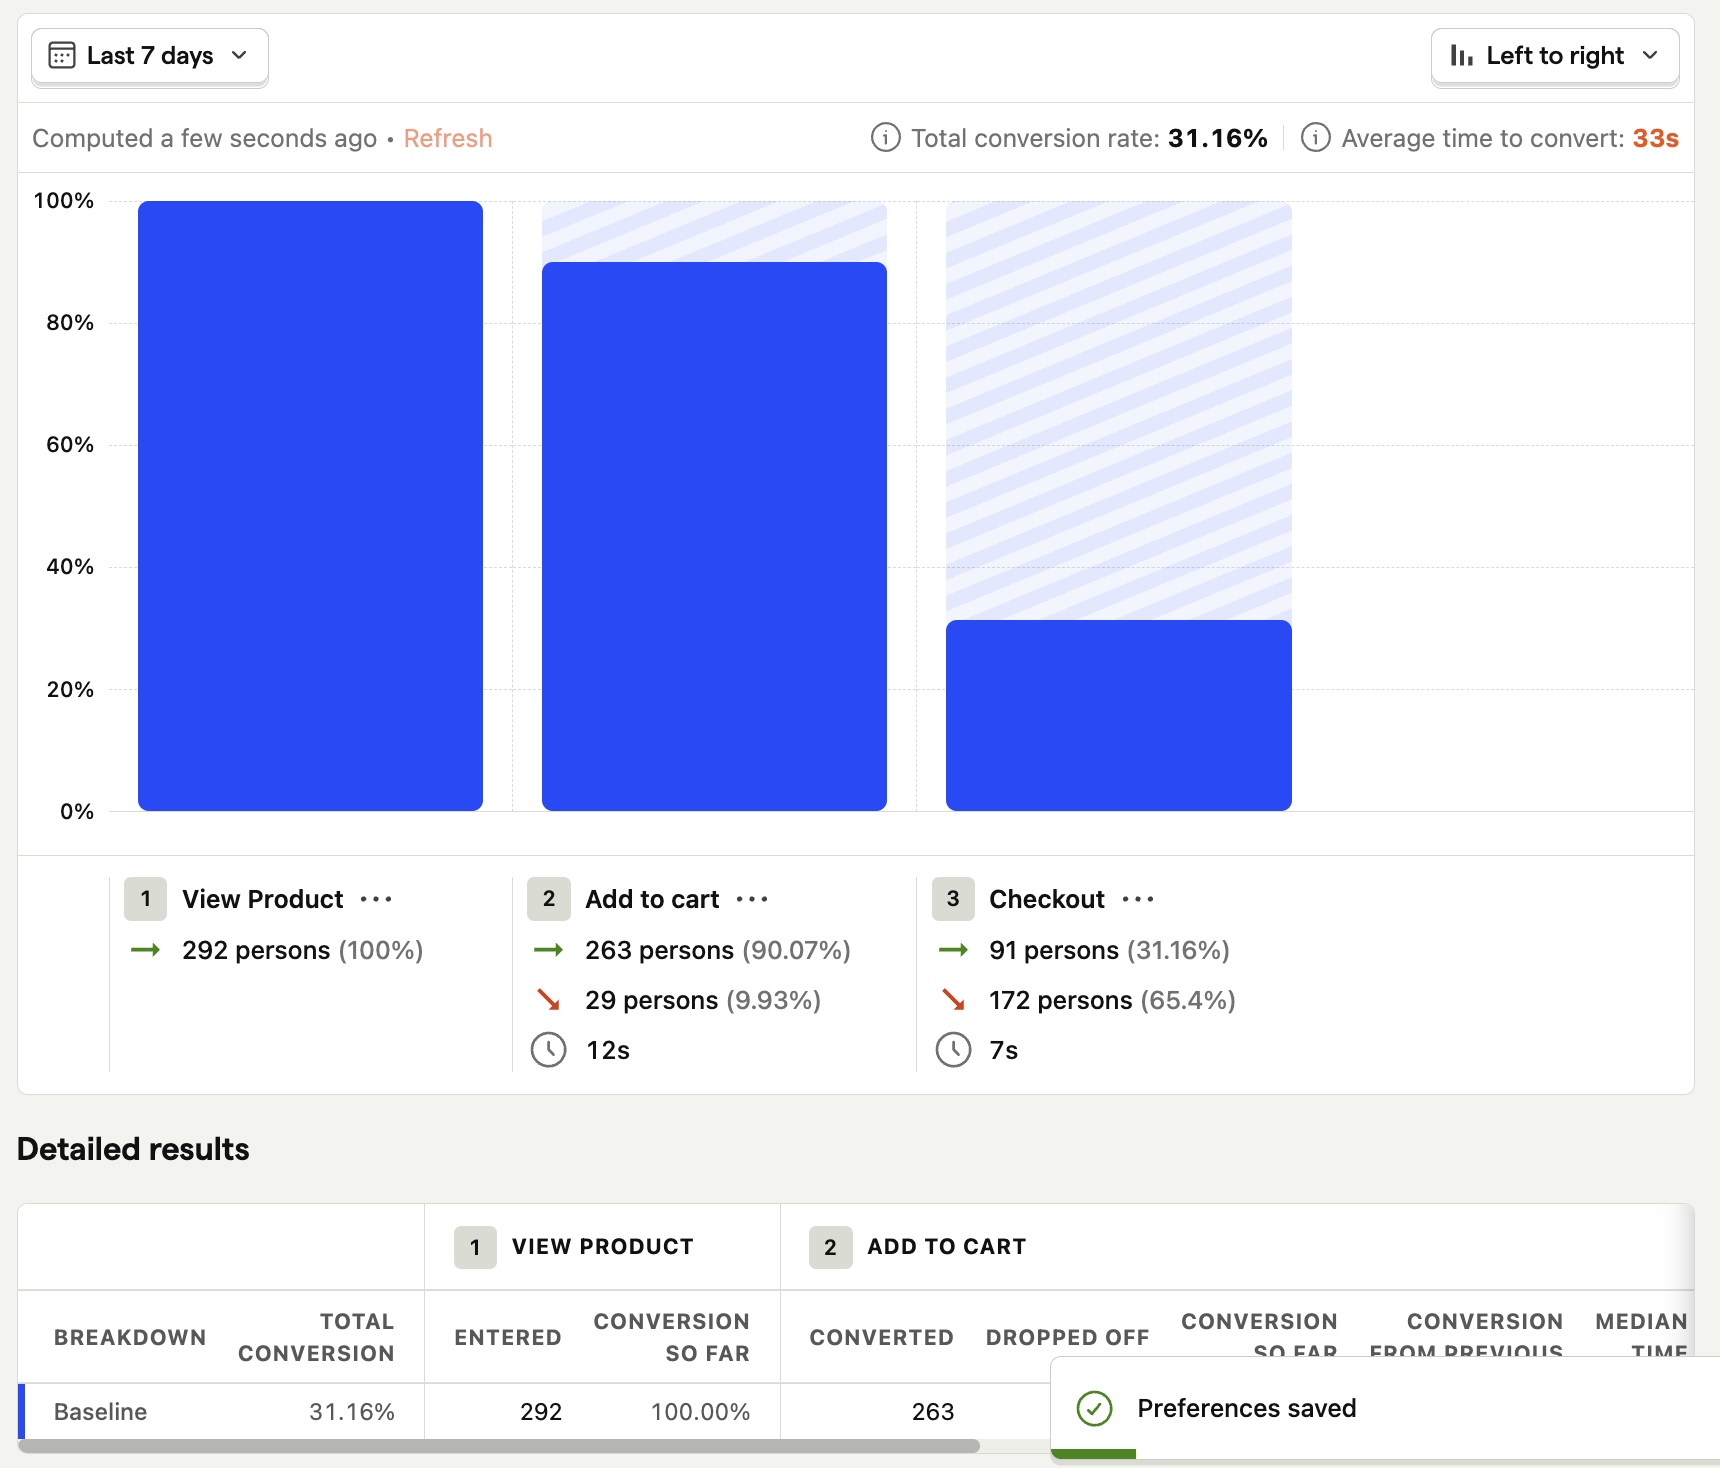
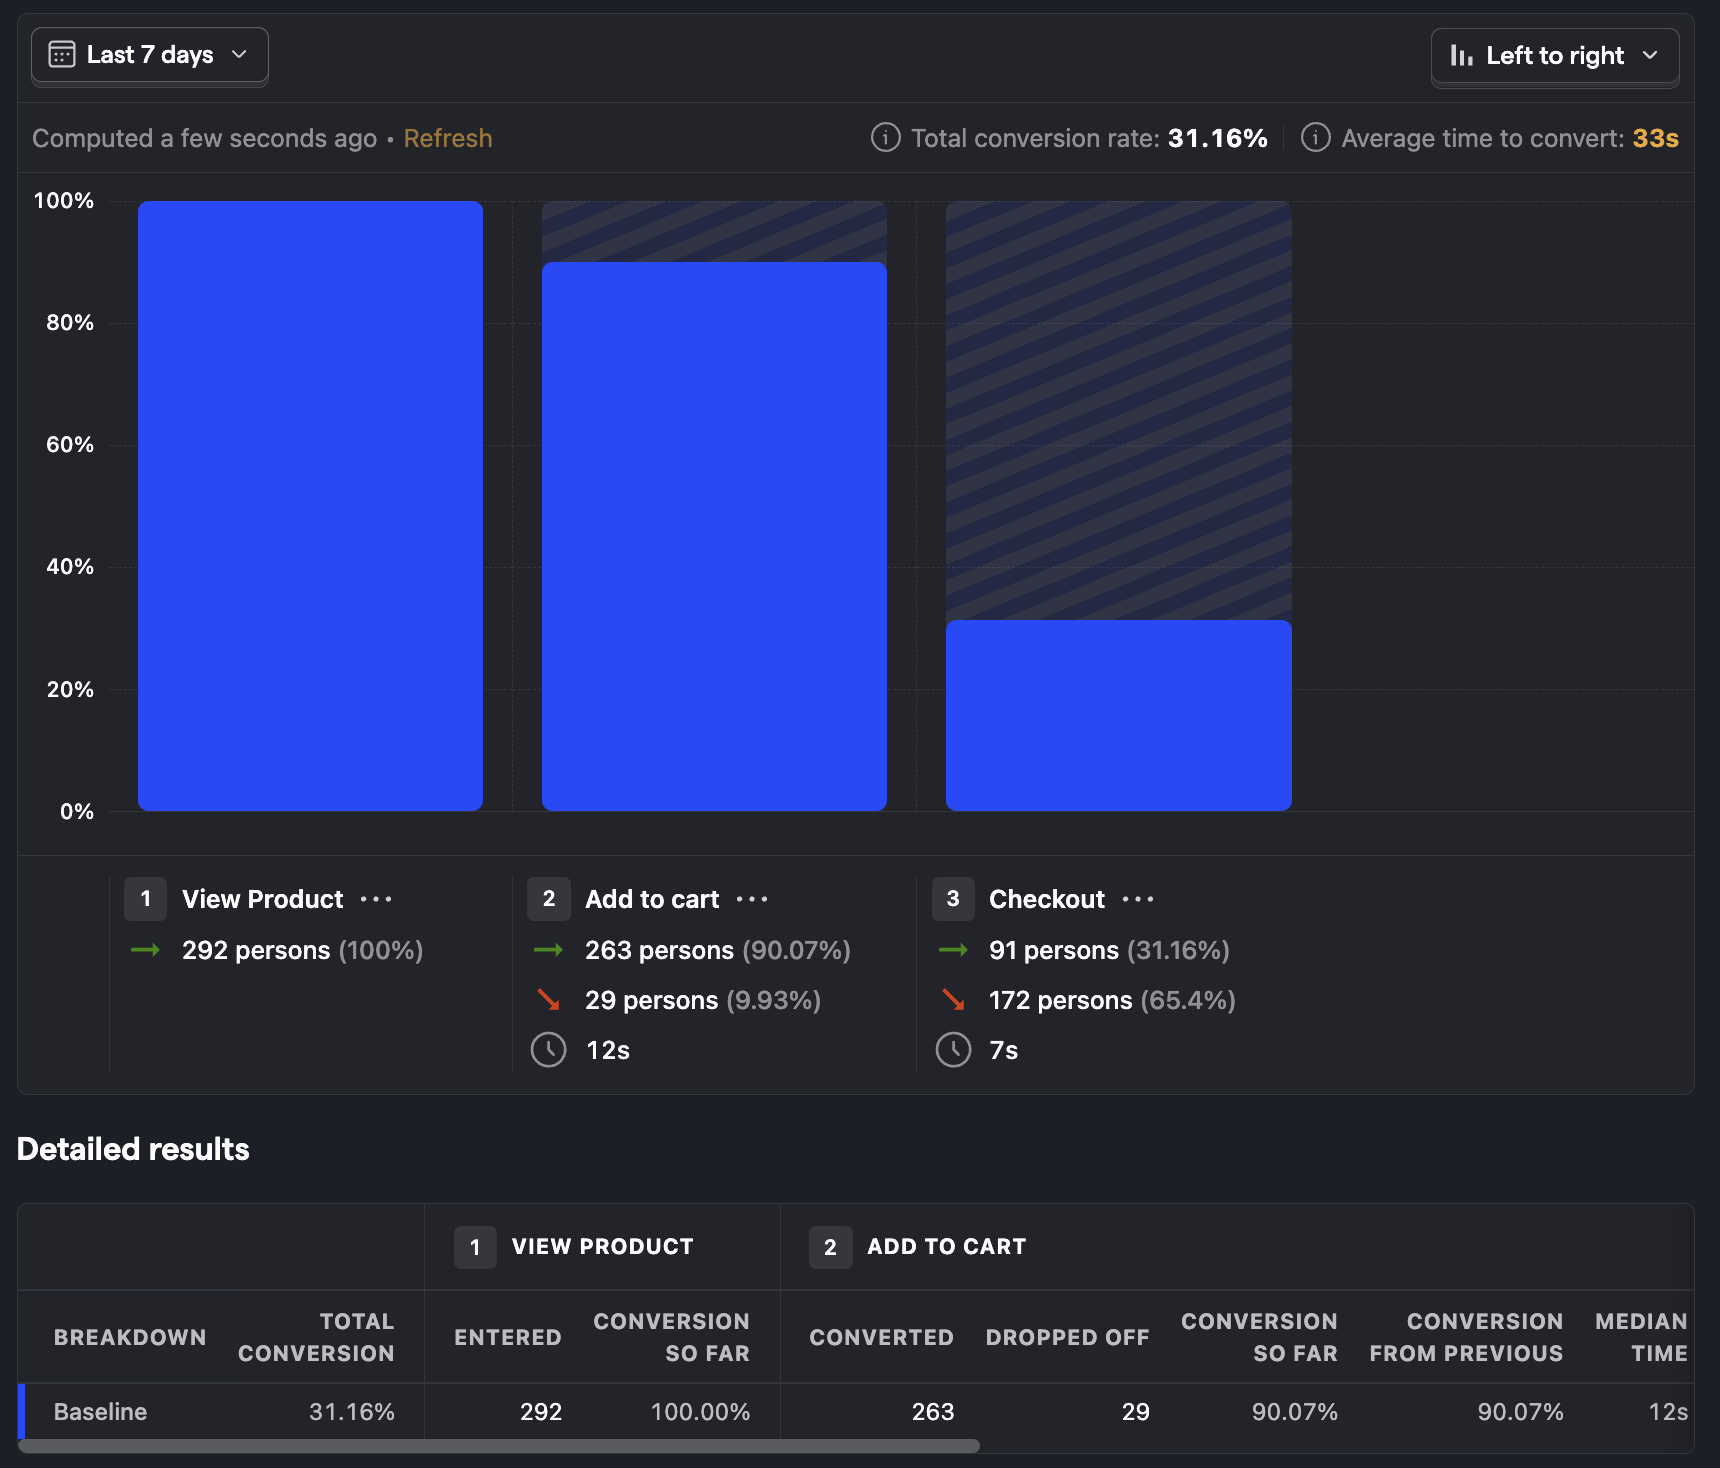
Find where people are getting stuck during onboarding with funnels
Use funnels to understand where people are getting stuck or dropping off in your flow.
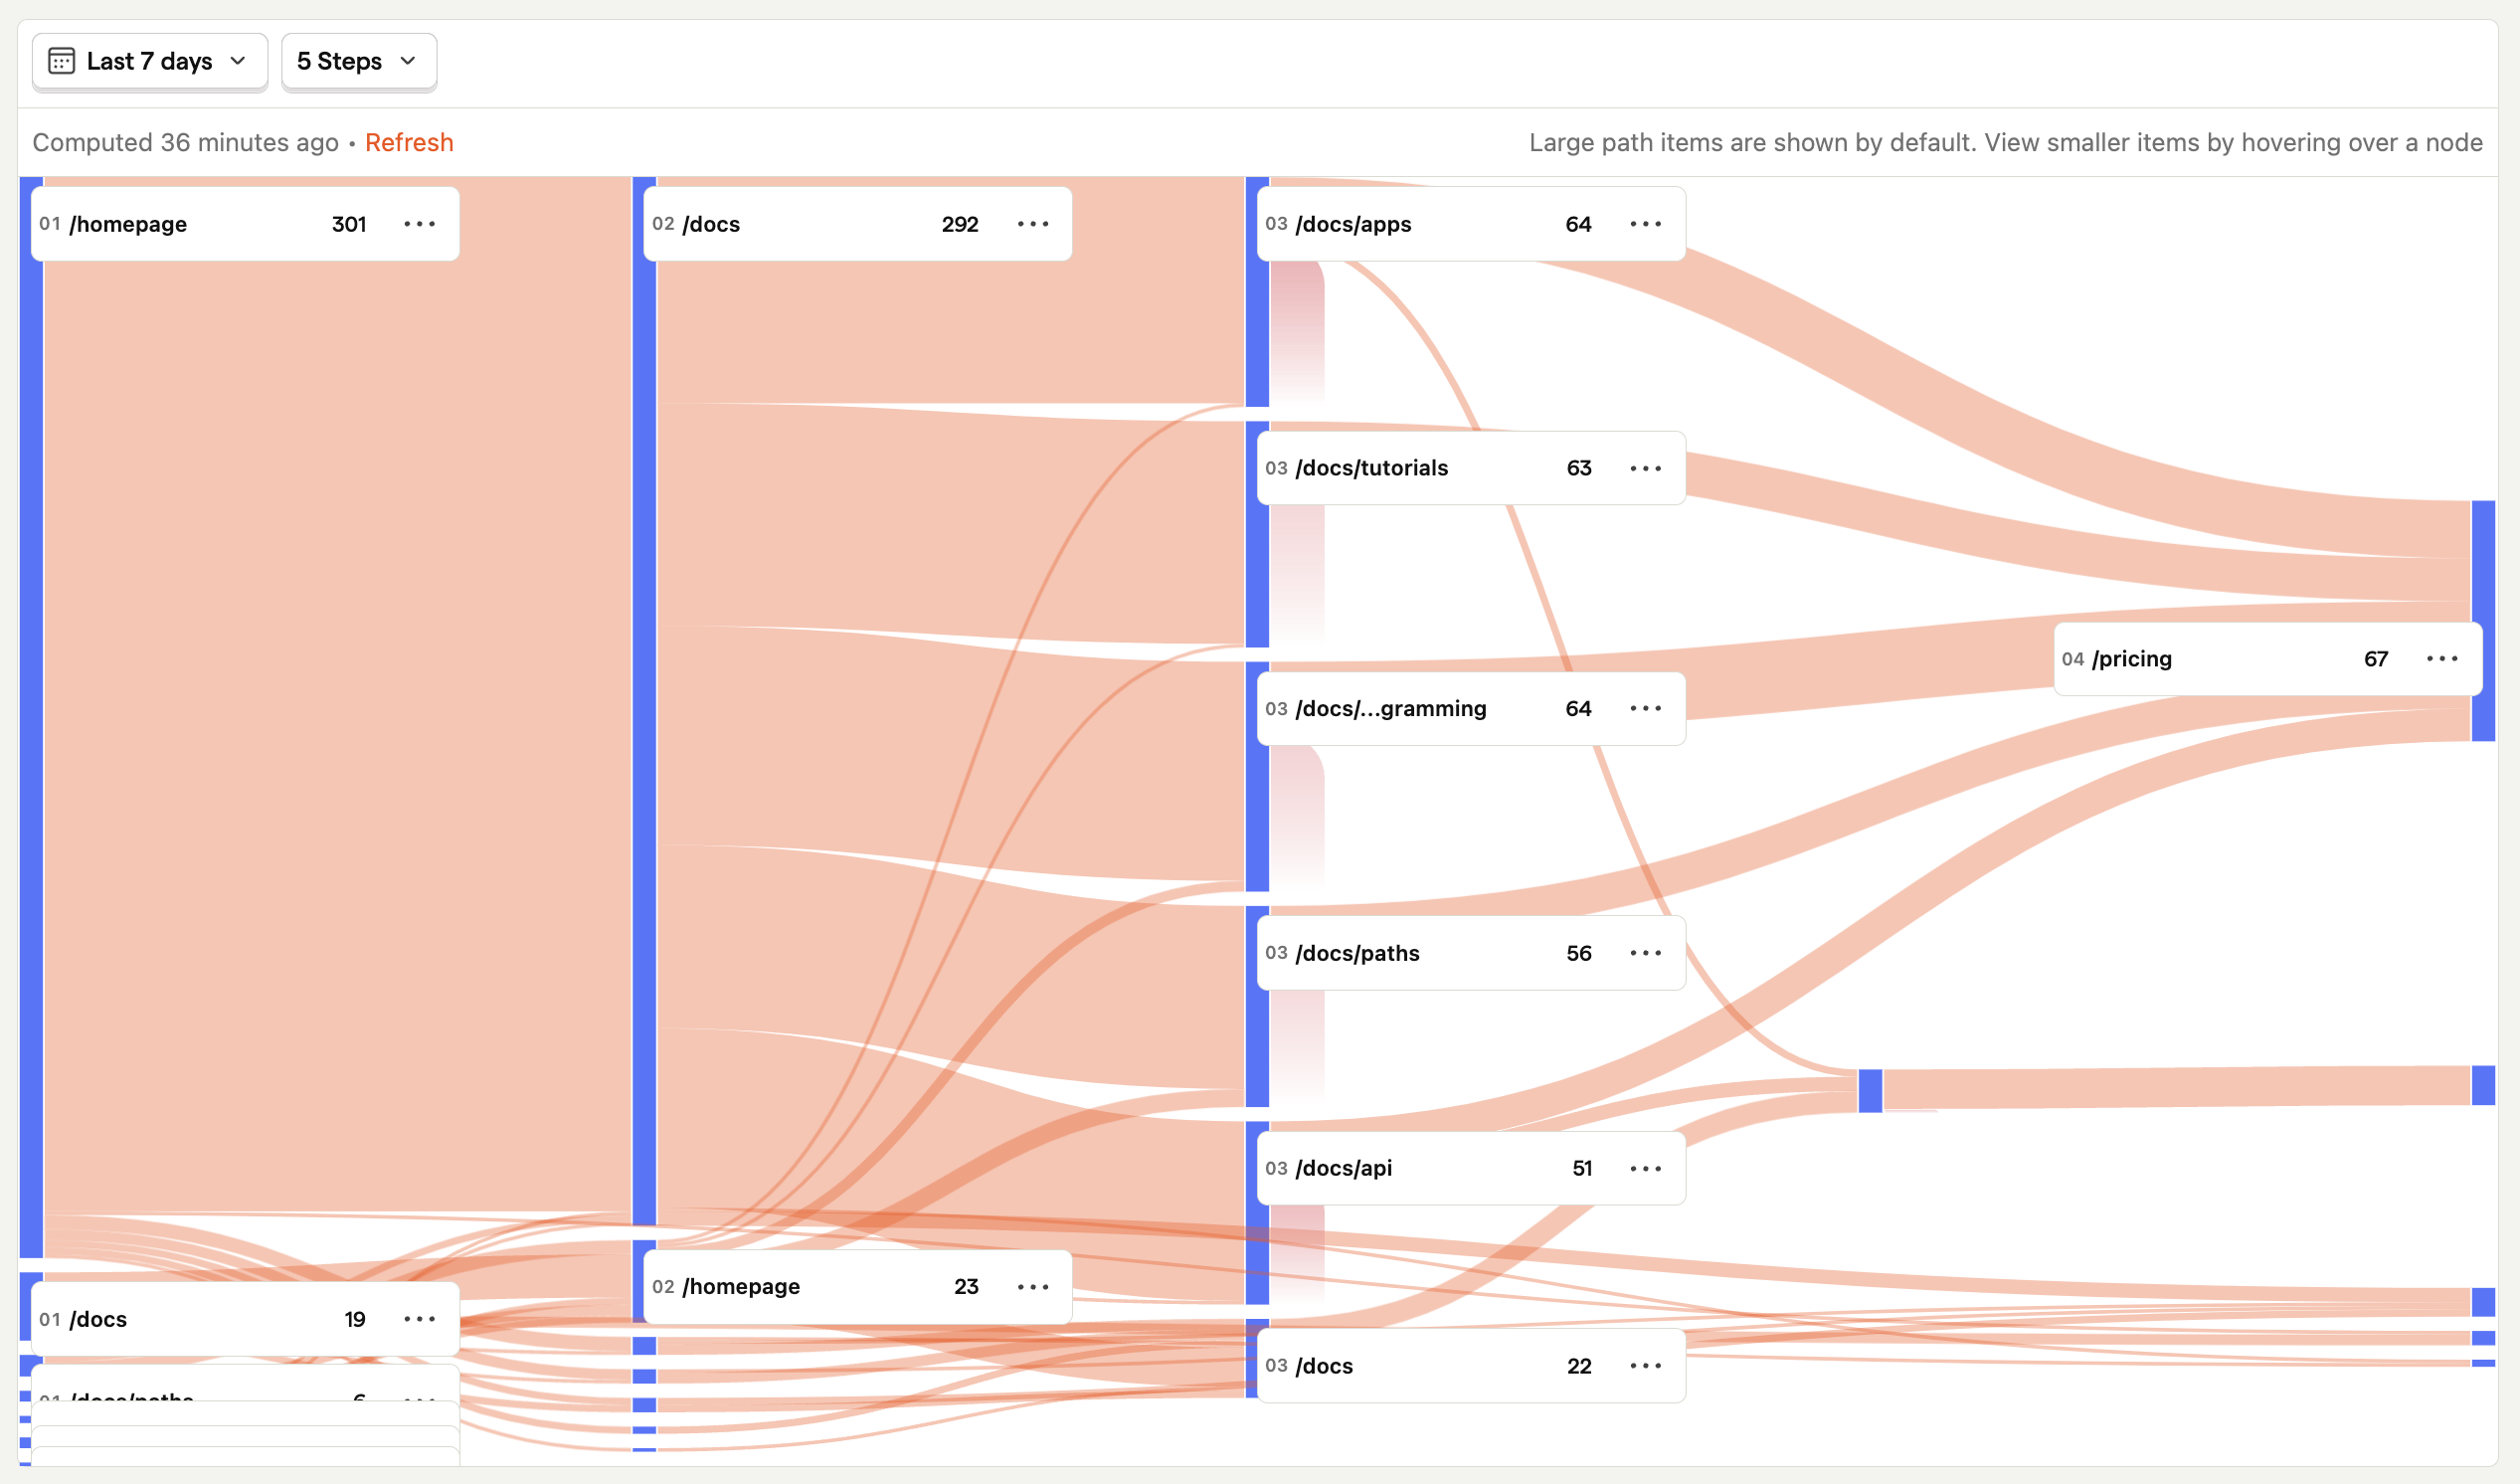
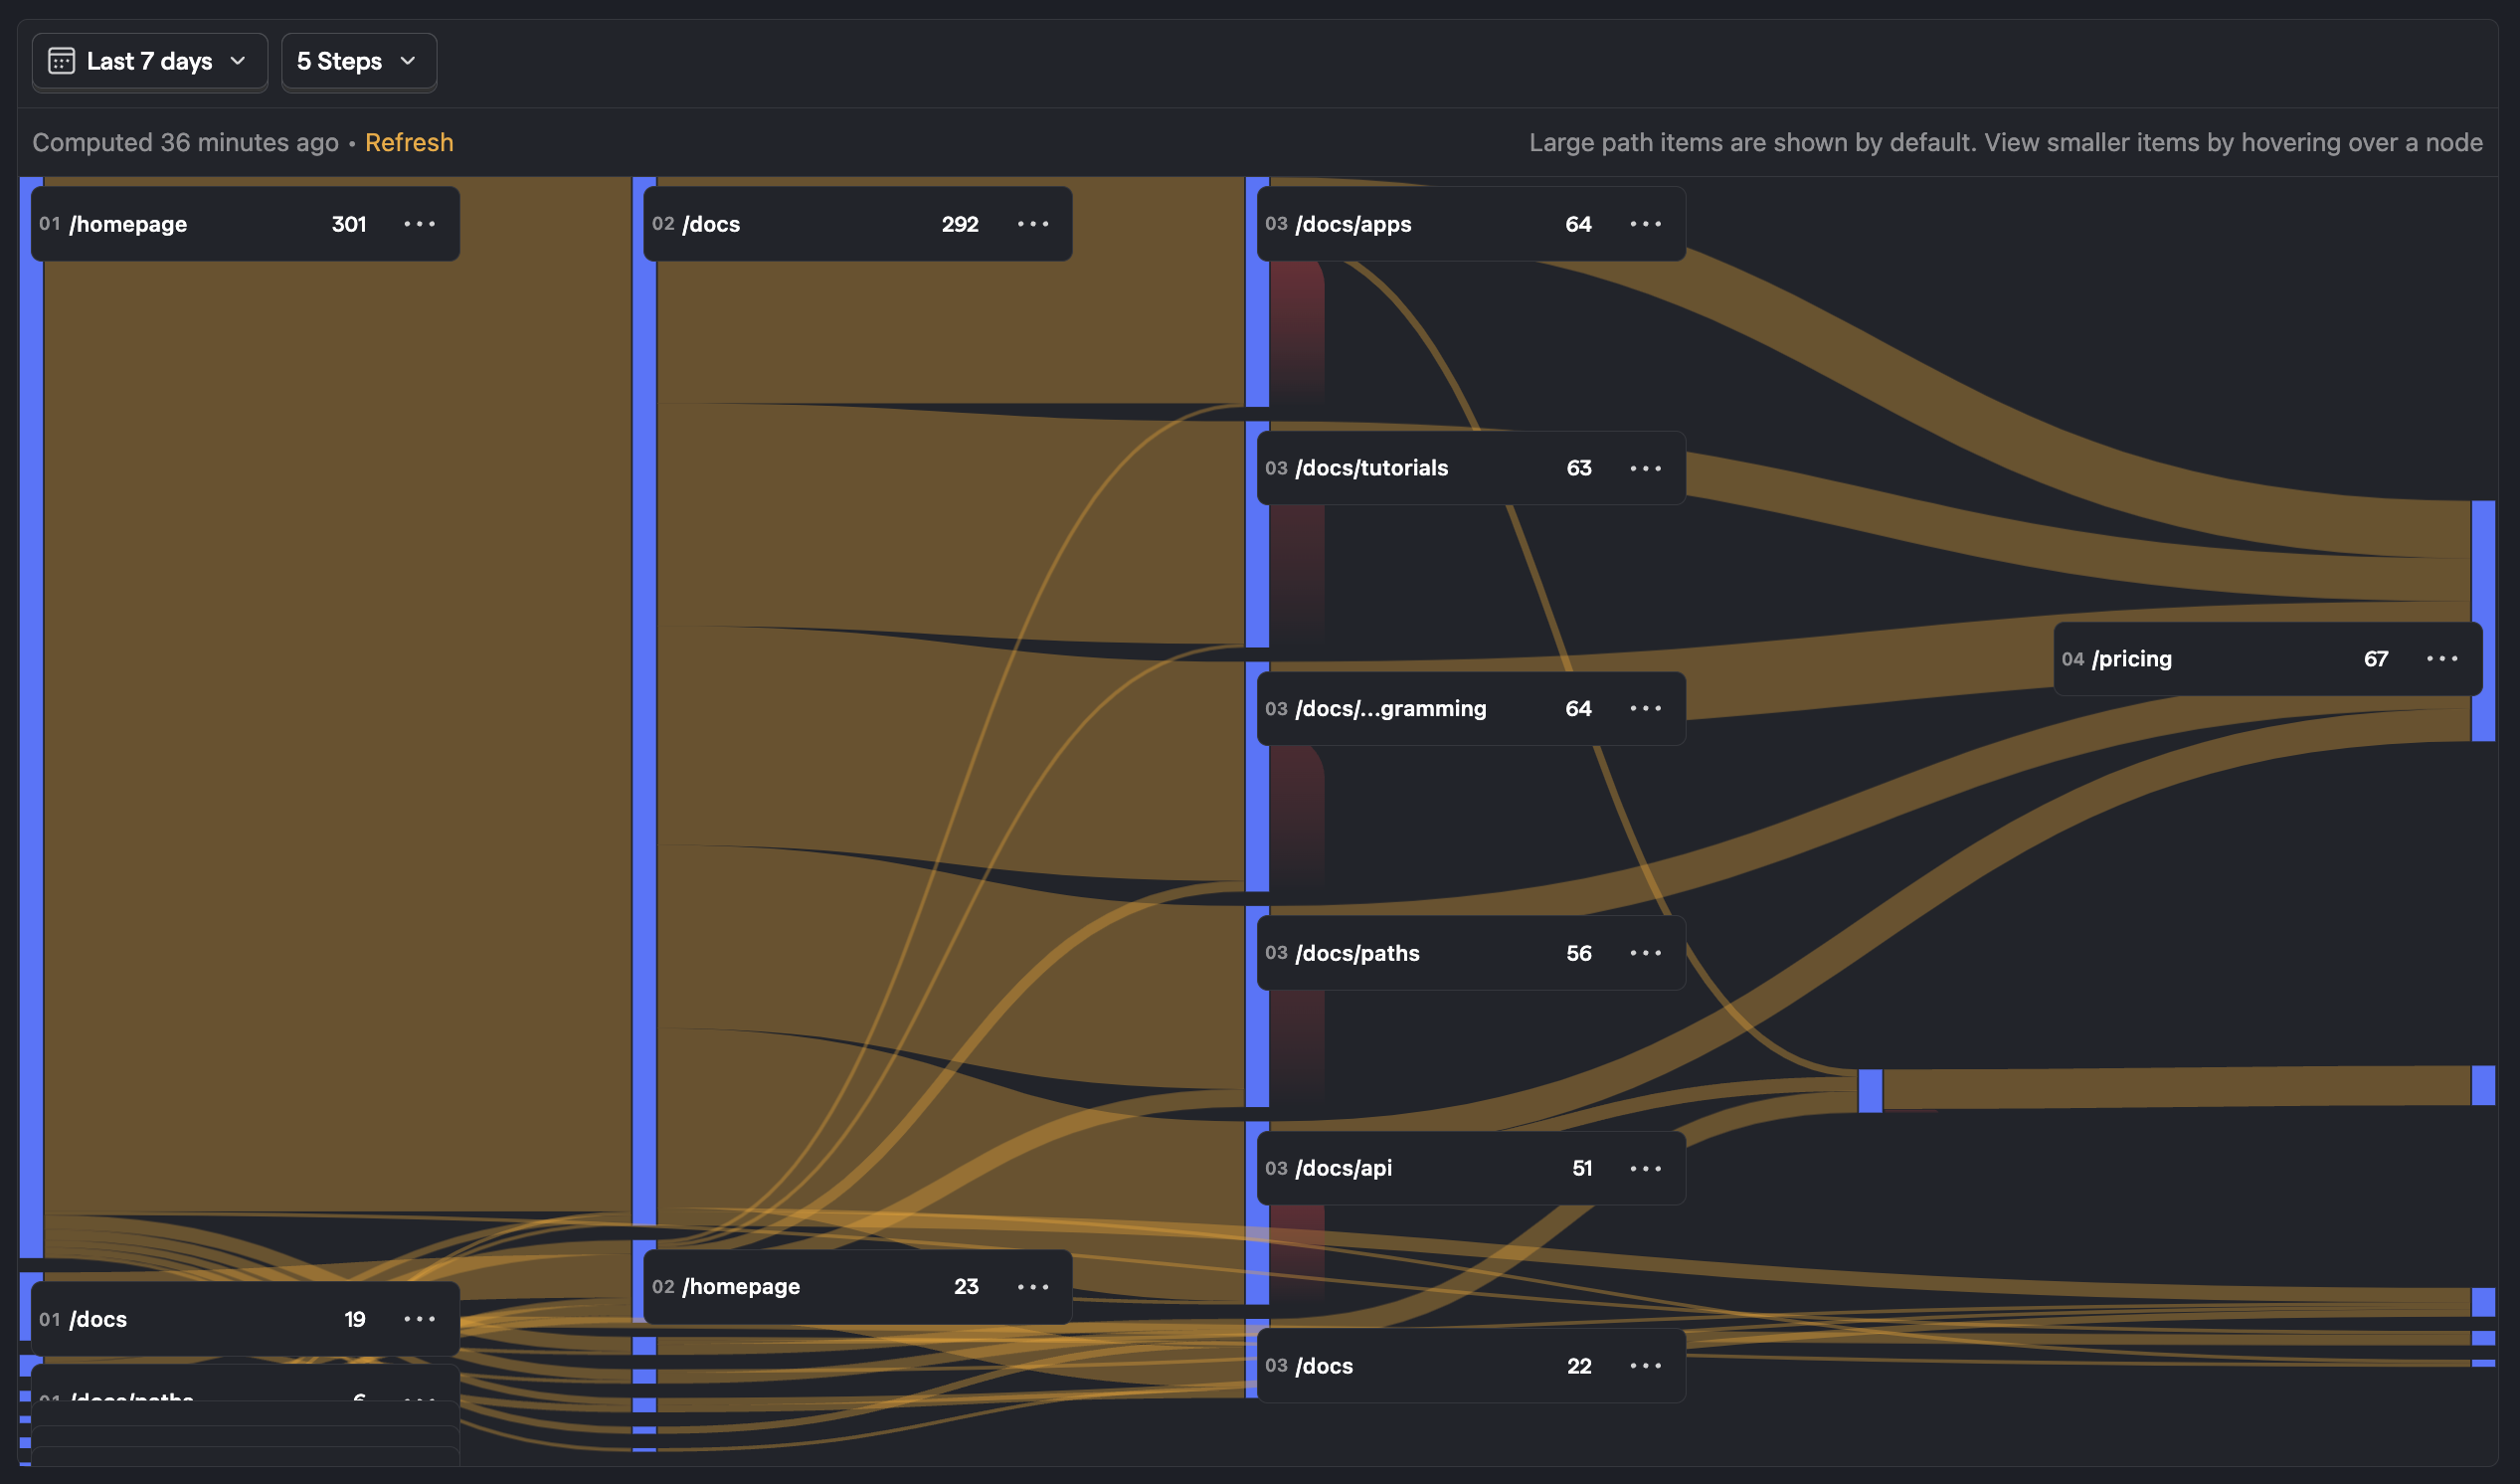
Follow users along their journey through your product with user paths
Use user paths to find which parts of your product people are actually using, where users are getting confused or stuck, etc.
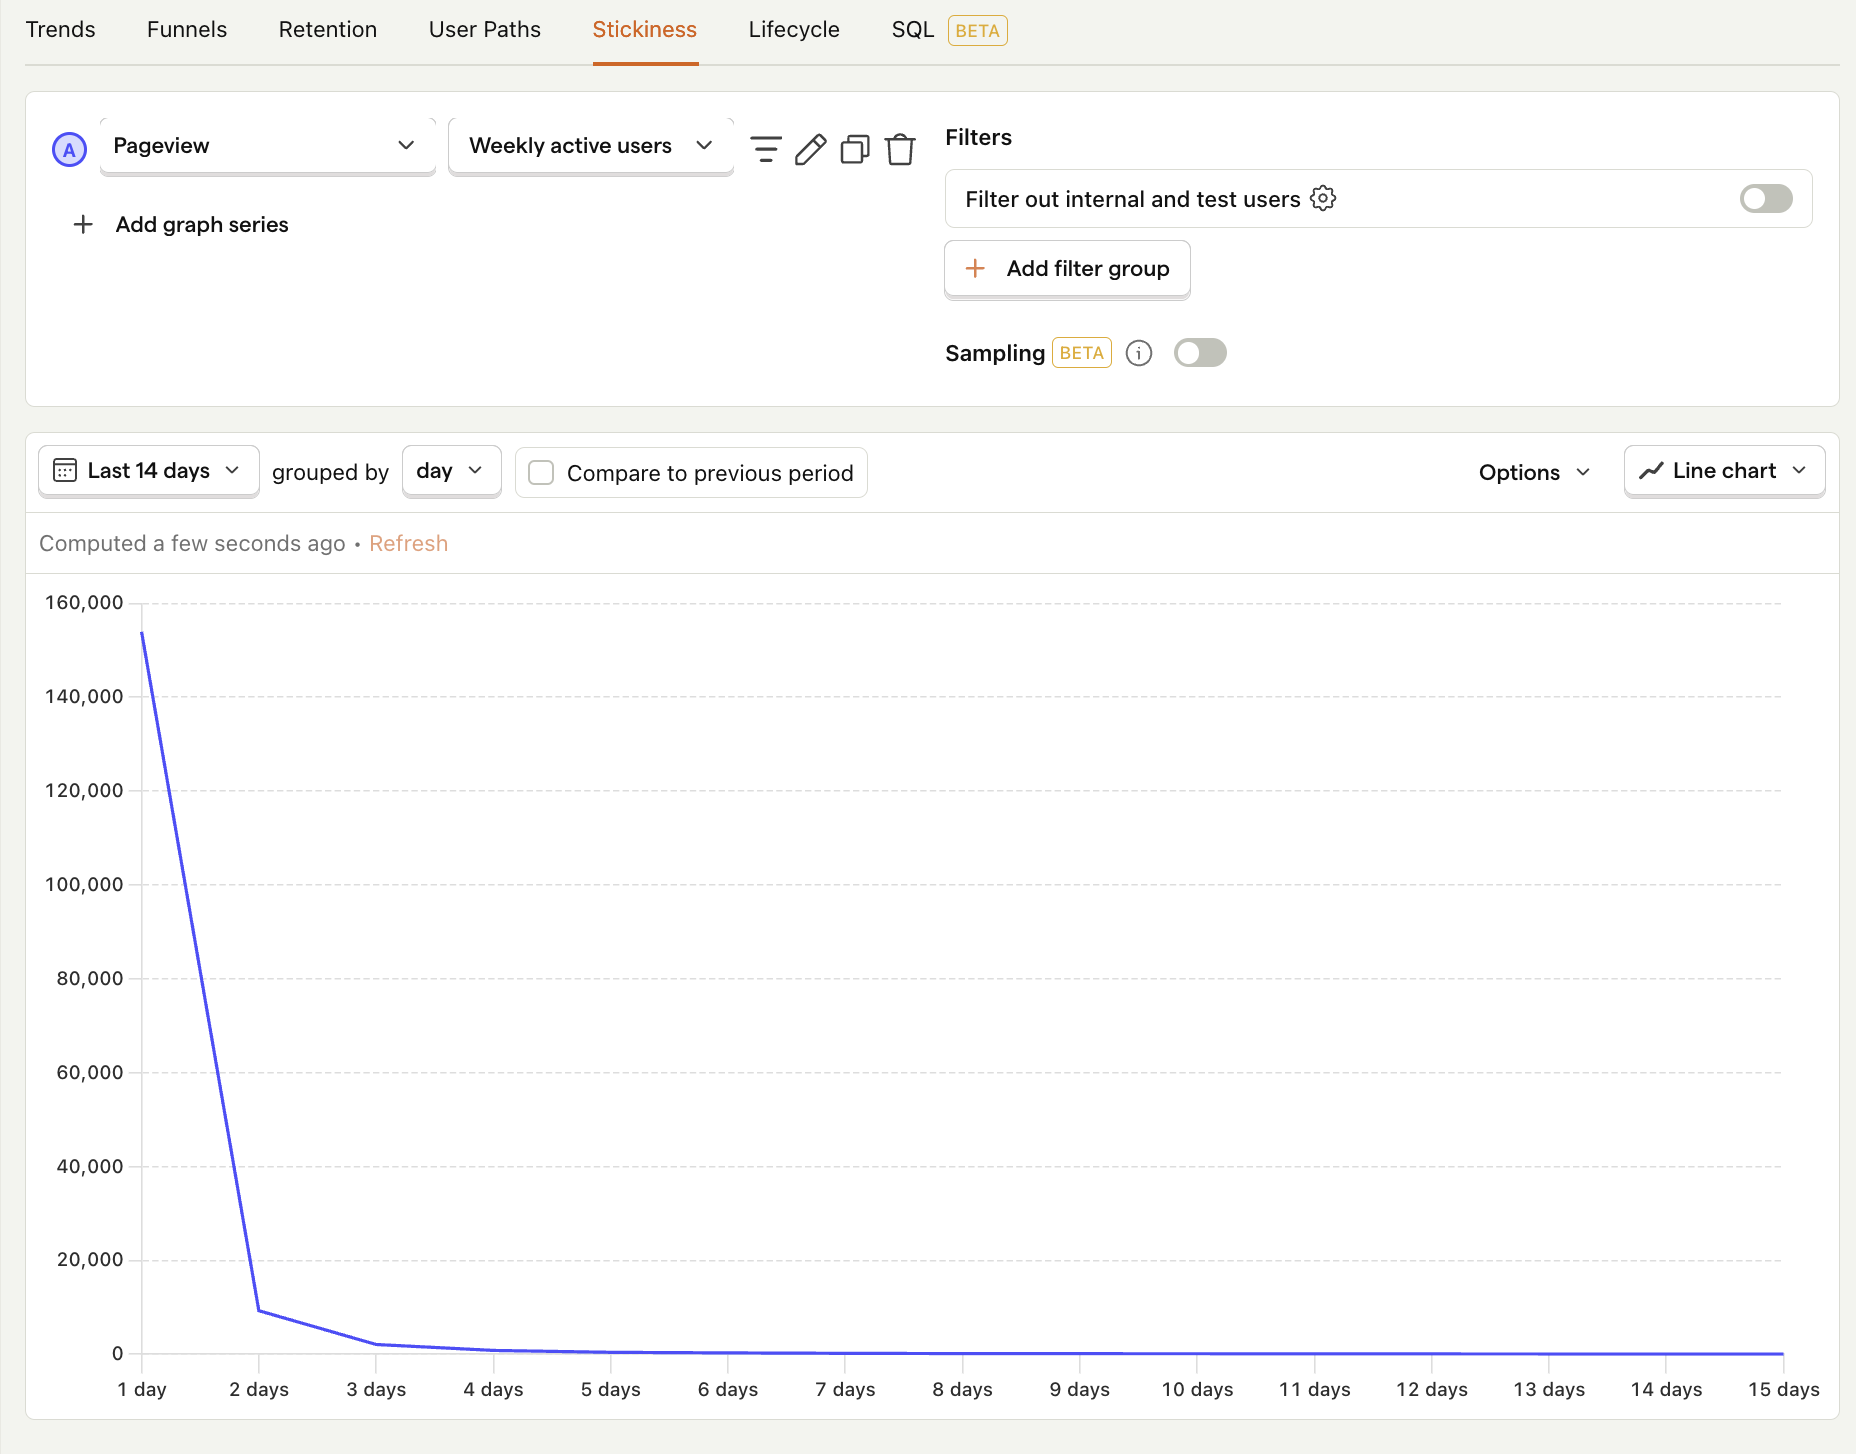
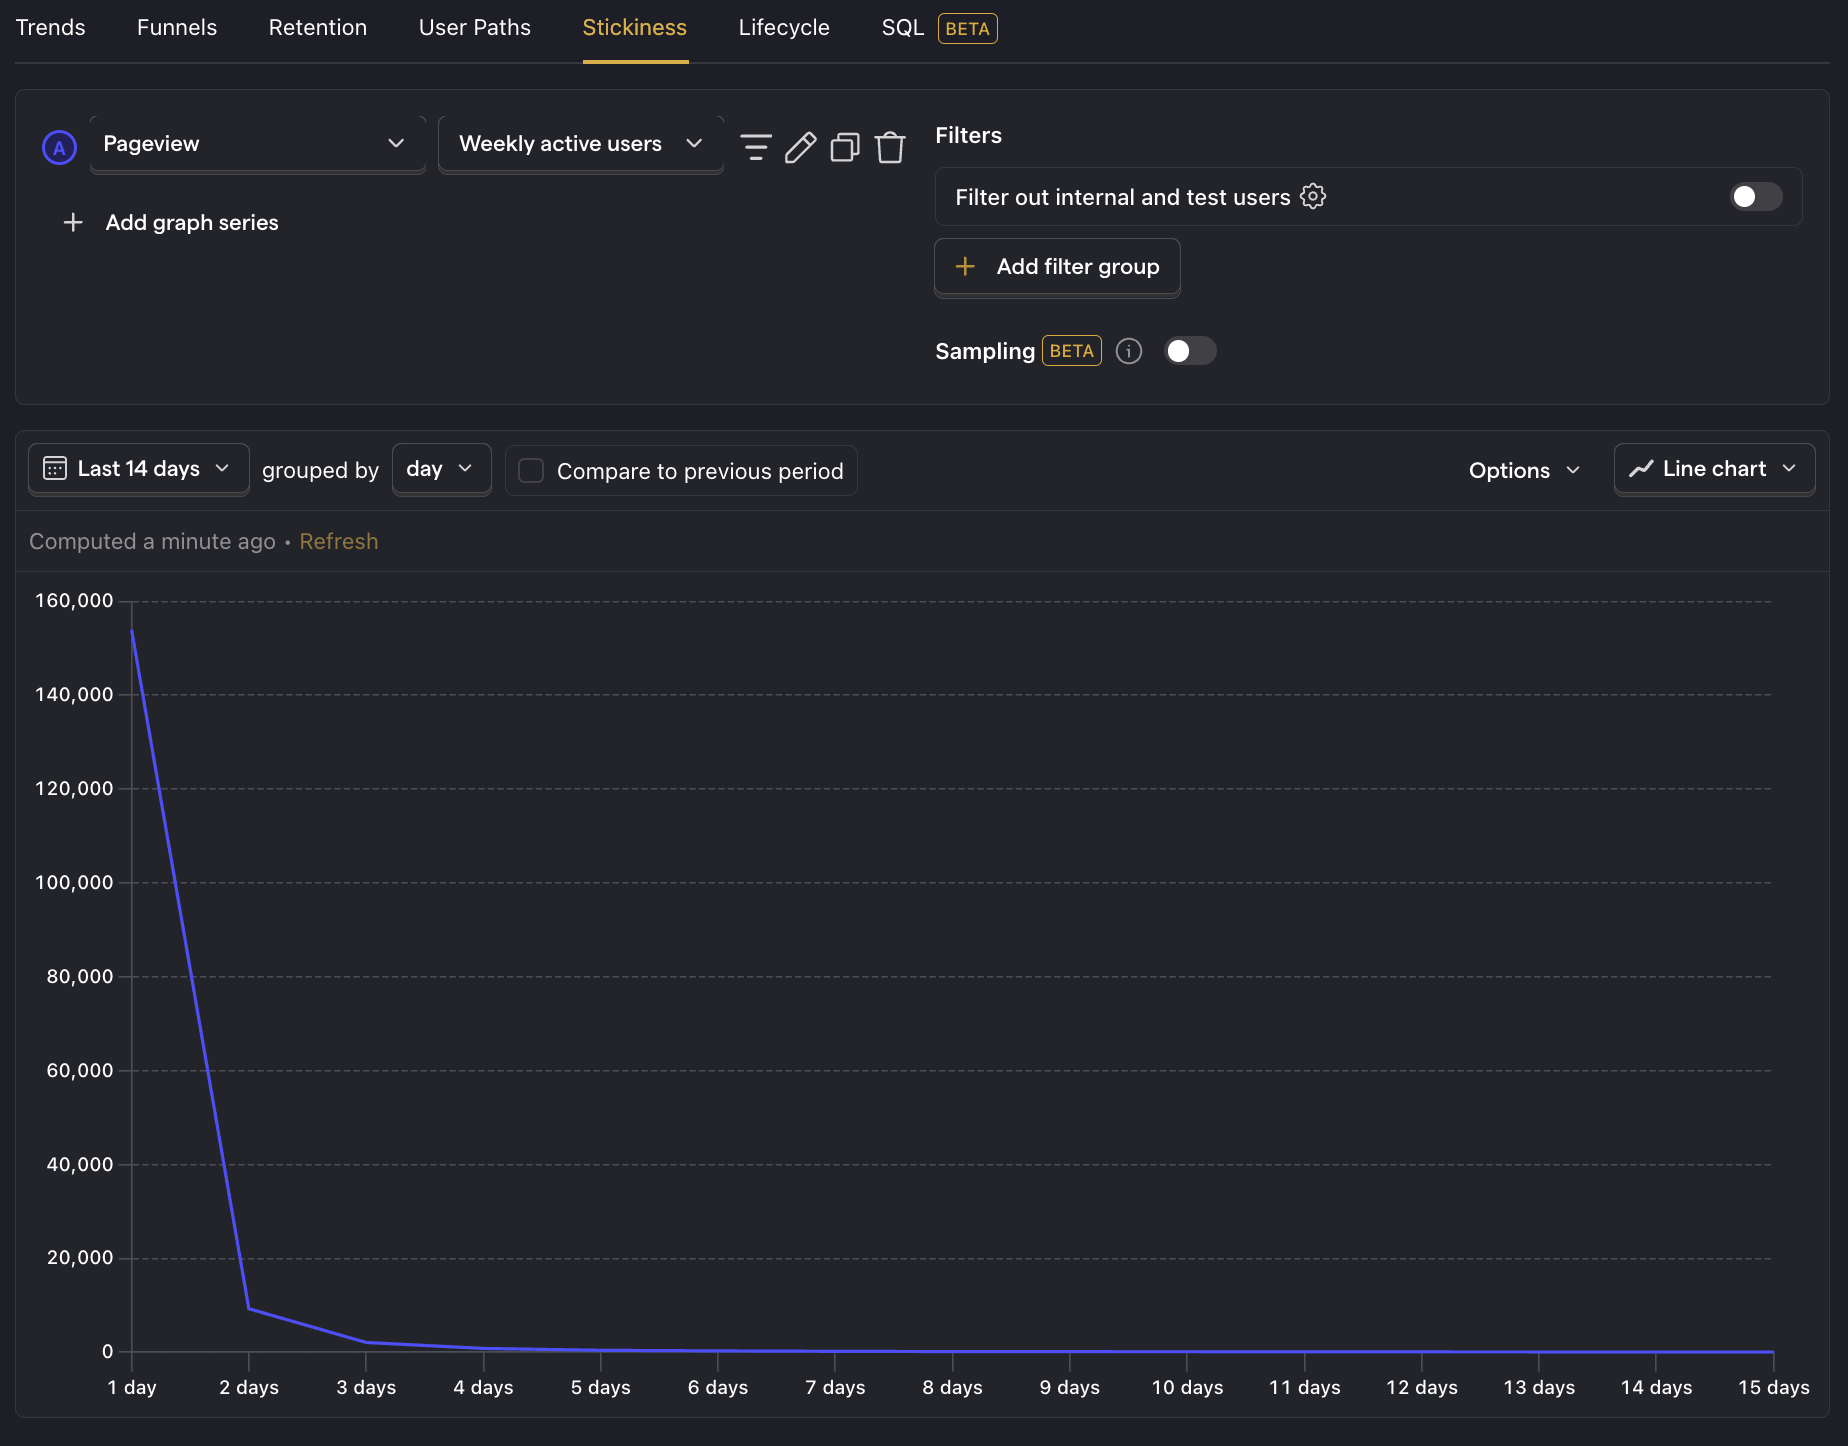
Look for particularly engaging features with stickiness
Use stickiness to find engaging features by seeing how many times users perform an event within a specific time period.
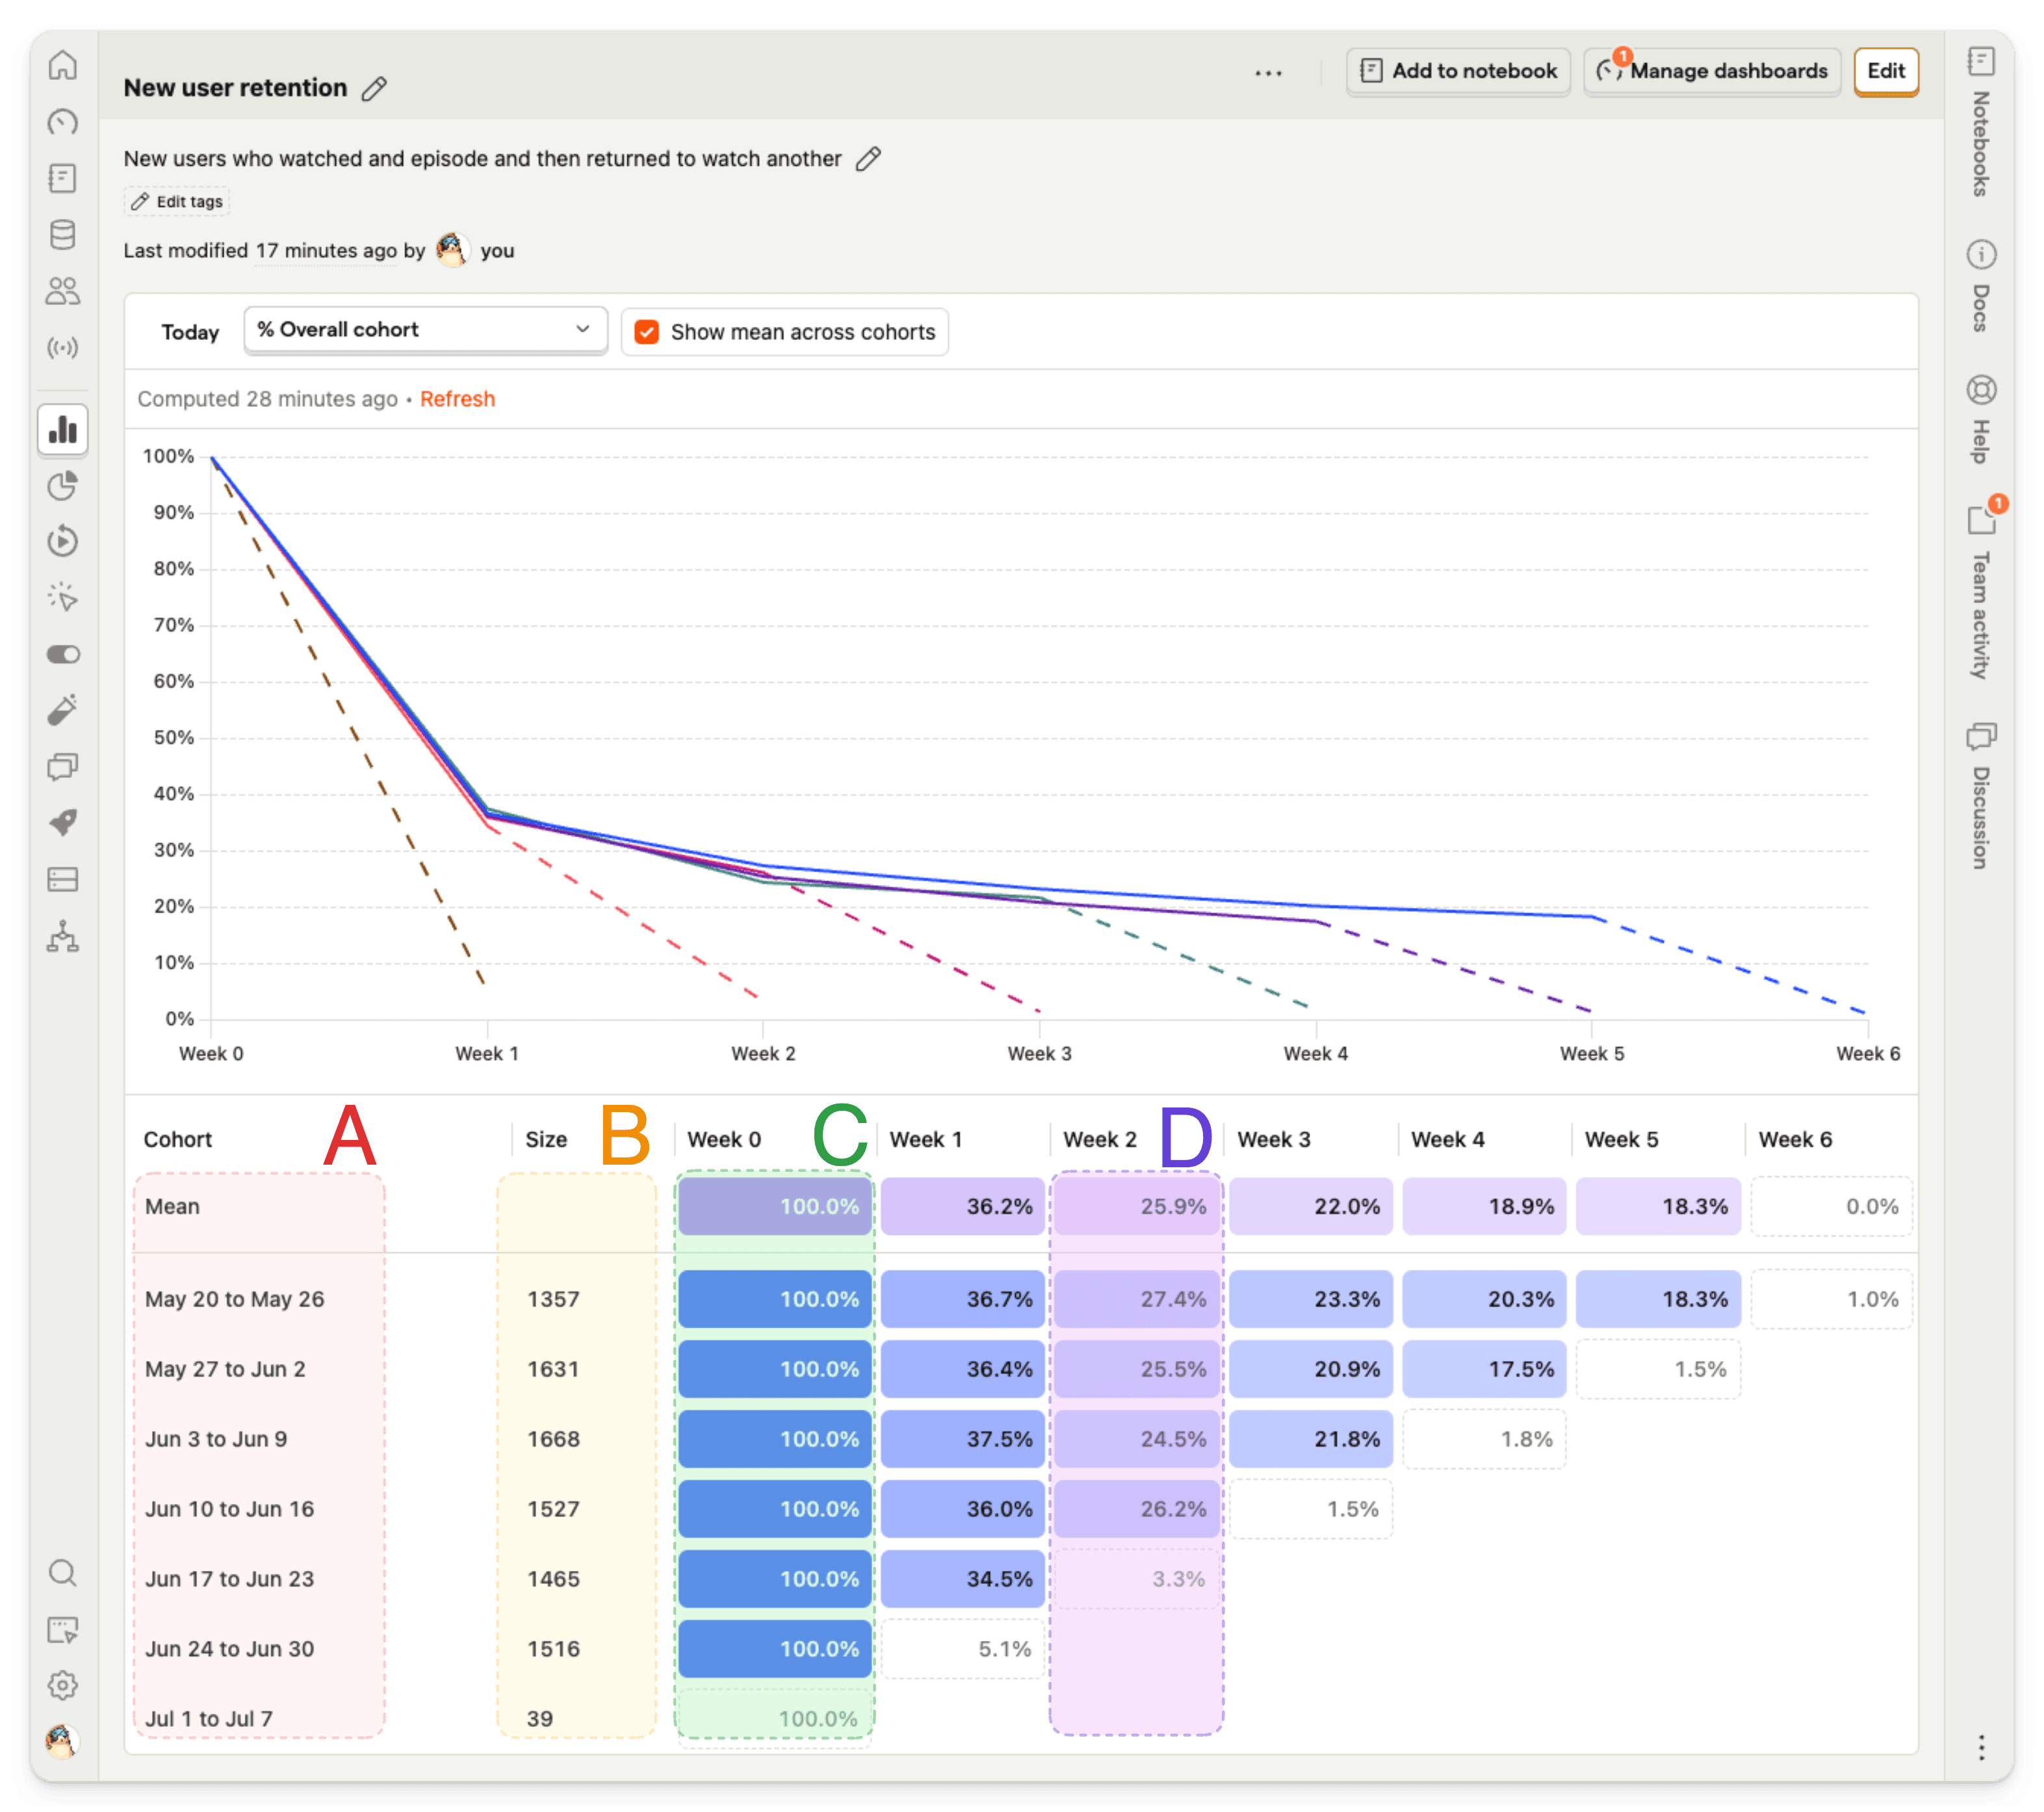
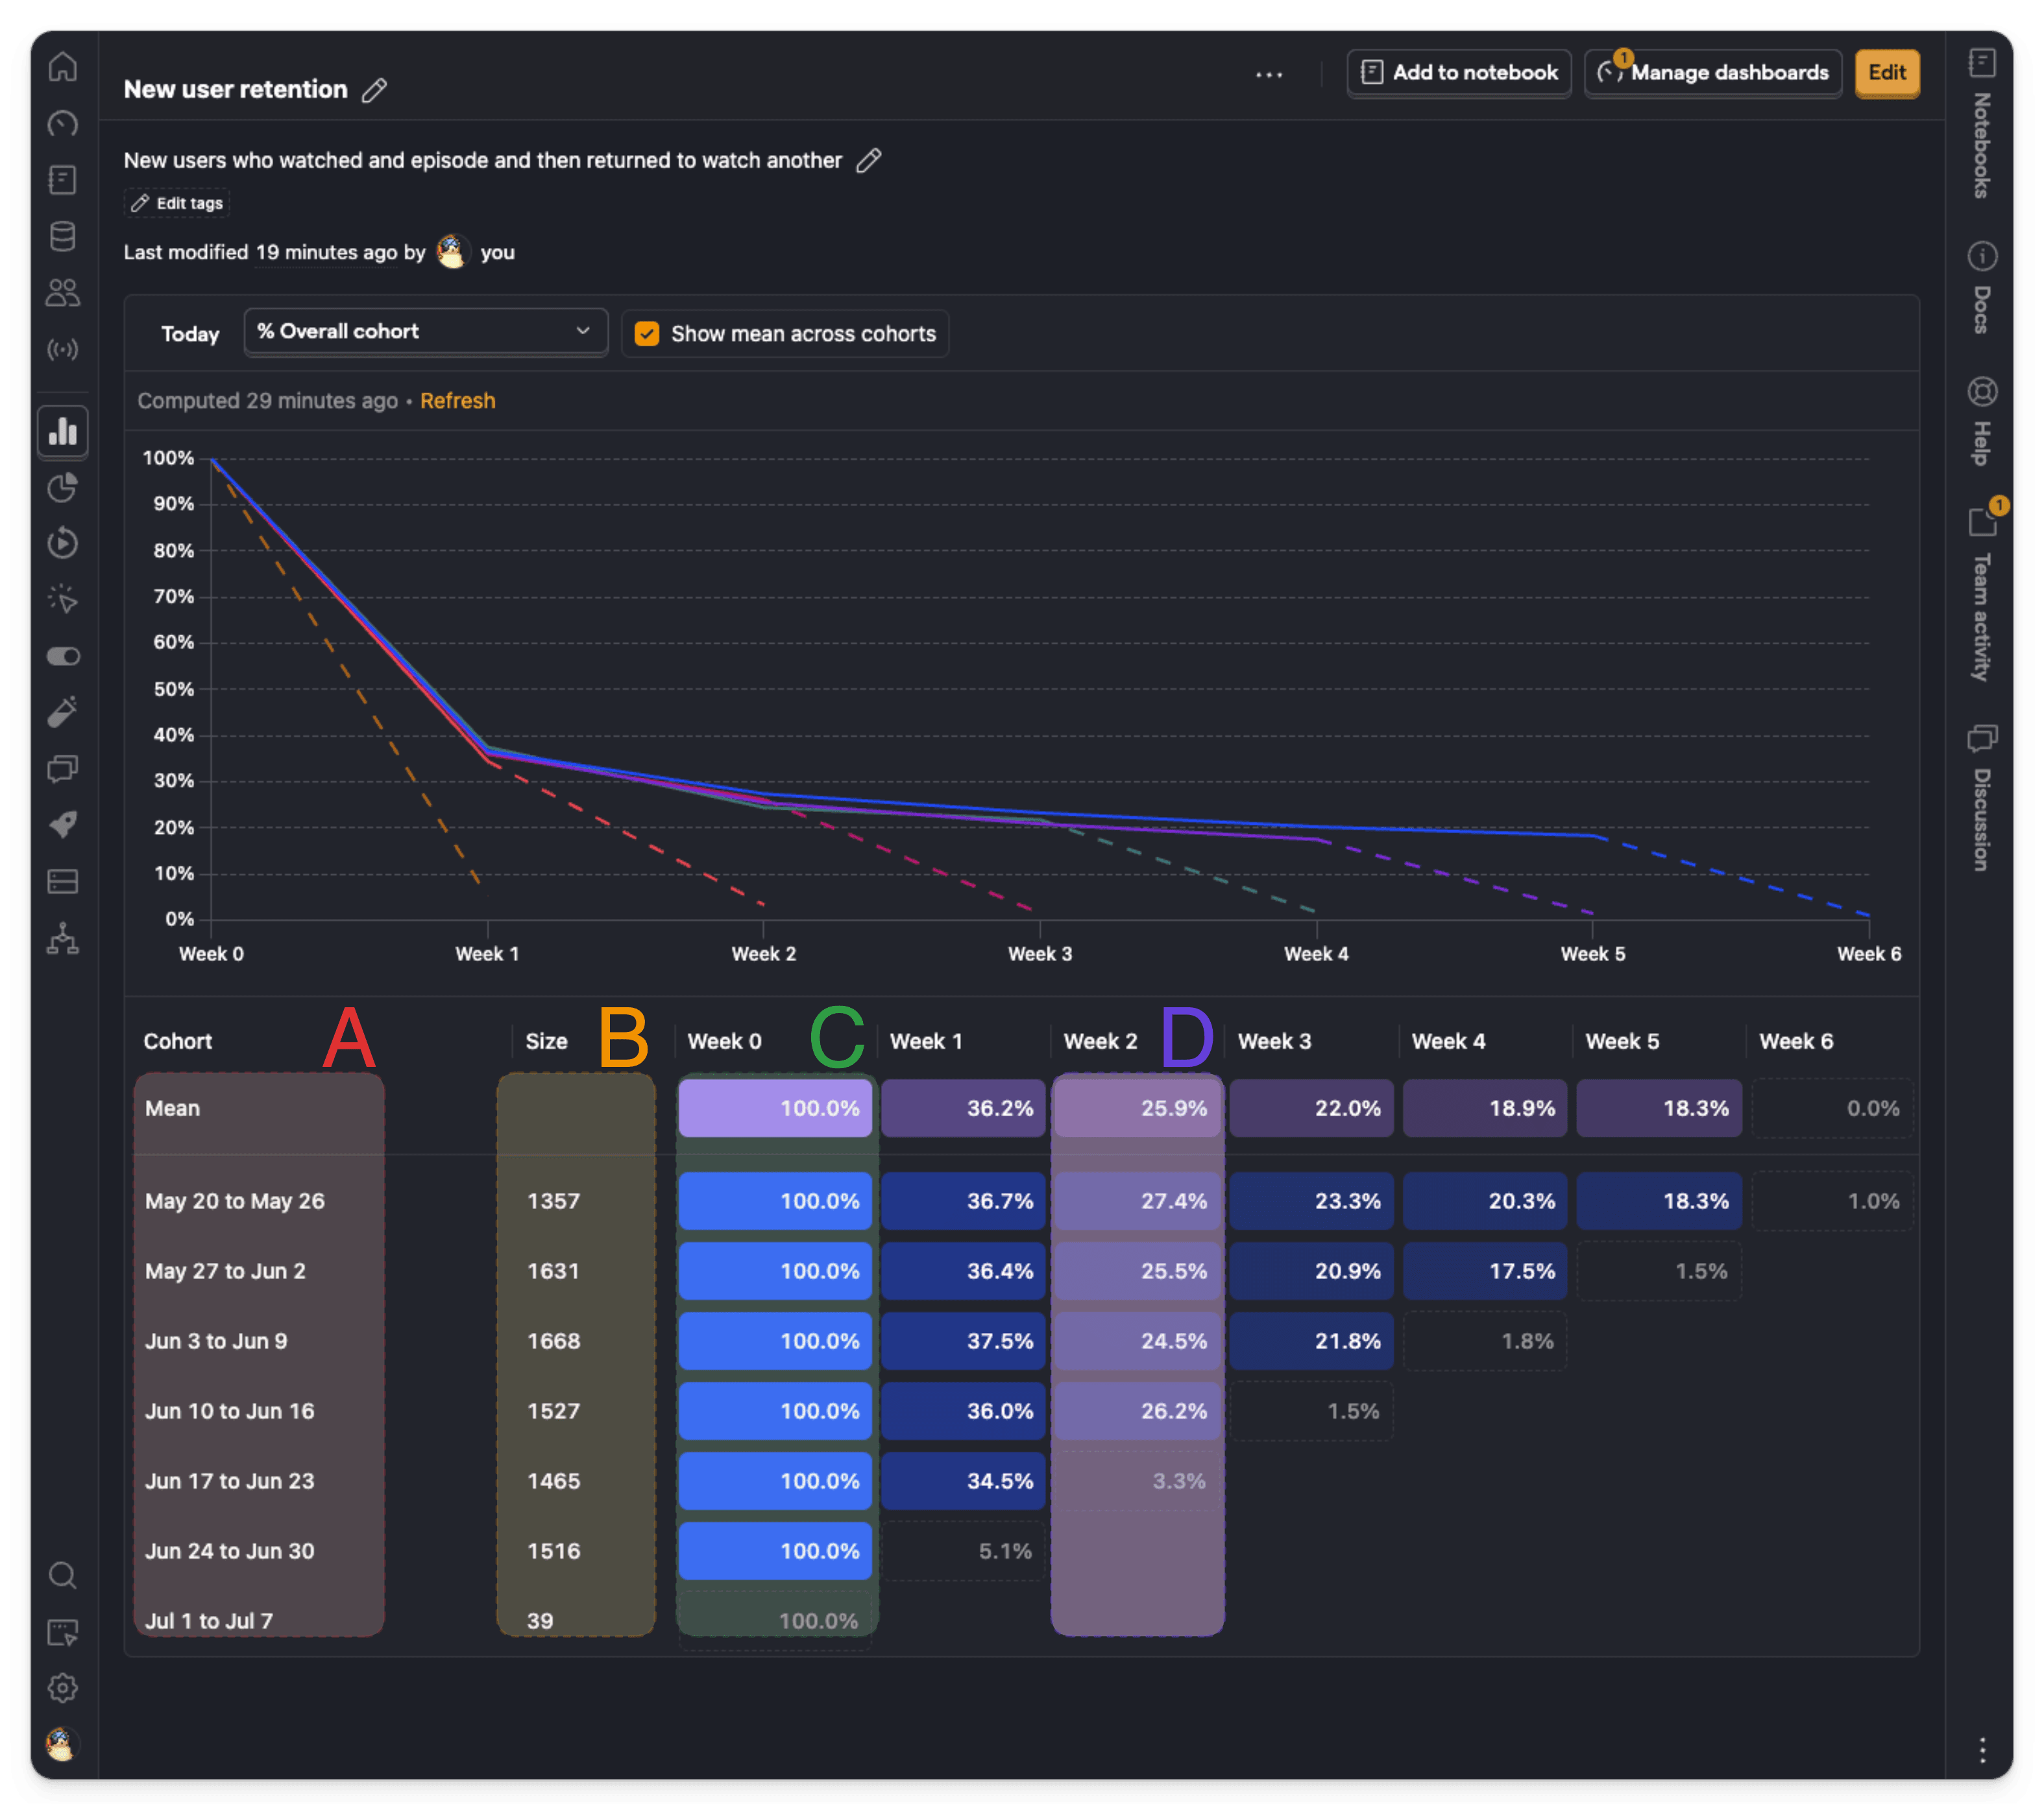
Visualize user cohorts and retention metrics
Use retention insights to find how many users sign up and come back to use your product after trying it.
Check out the product analytics docs for more examples and guides.